PLOT Procedure
- Syntax

- Overview
- Concepts
- Results
- Examples Specifying a Plotting SymbolControlling the Horizontal Axis and Adding a Reference LineOverlaying Two PlotsProducing Multiple Plots per PagePlotting Data on a Logarithmic ScalePlotting Date Values on an AxisProducing a Contour PlotPlotting BY GroupsAdding Labels to a PlotExcluding Observations That Have Missing ValuesAdjusting Labels on a Plot with the PLACEMENT= OptionAdjusting Labeling on a Plot with a MacroChanging a Default Penalty
Overview: PLOT Procedure
The PLOT procedure plots
the values of two variables for each observation in an input SAS data
set. The coordinates of each point on the plot correspond to the two
variables' values in one or more observations of the input data set.
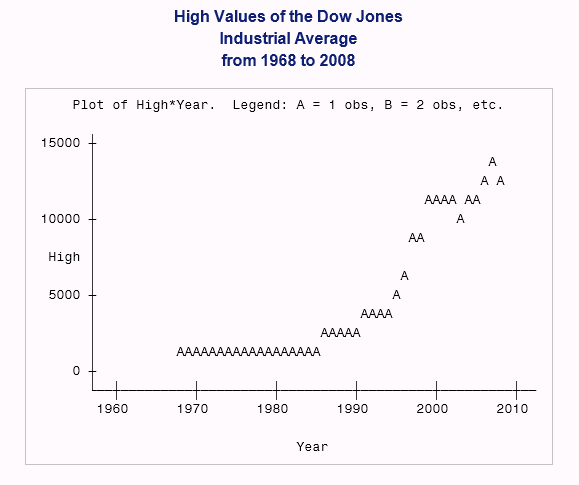
The following output
is a simple plot of the high values of the Dow Jones Industrial Average
(DJIA) between 1968 and 2008. PROC PLOT determines the plotting symbol
and the scales for the axes. Here are the statements that produce
the output:
options nodate pageno=1 linesize=64
   pagesize=25;

proc plot data=djia;
   plot high*year;
   title 'High Values of the Dow Jones';
   title2 'Industrial Average';
   title3 'from 1968 to 2008';
run;
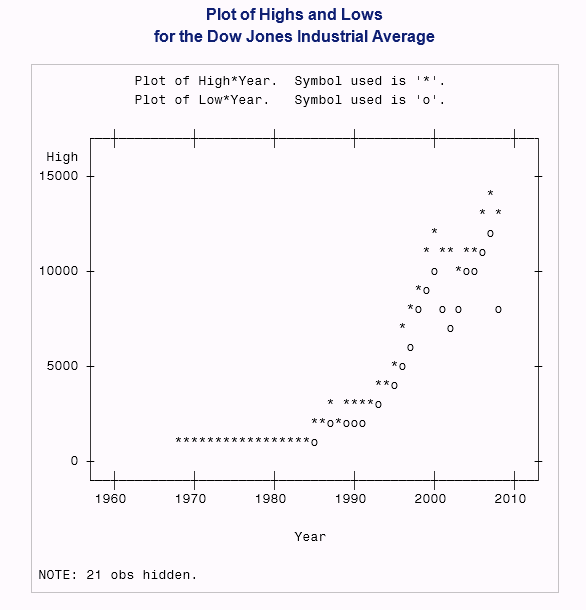
You can also overlay
two plots, as shown in the following output. One plot shows the high
values of the DJIA; the other plot shows the low values. The plot
also shows that you can specify plotting symbols and put a box around
a plot. The
statements that produce the following output are shown in Overlaying Two Plots.
PROC PLOT can also label
points on a plot with the values of a variable, as shown in the following
output. The plotted data represents population density and crime rates
for selected U.S. states. The SAS code that produces the following output is shown
in Adjusting Labels on a Plot with the PLACEMENT= Option.
Labeling Points on a Plot
                             A Plot of Population Density and Crime Rates                                     3

                              Plot of Density*CrimeRate $ State.  Symbol is value of State.

               ---+------------+------------+------------+------------+------------+------------+------------+---
       Density |                                                                                                |
           500 +                                                                                                +
               |                                                                                                |
               |                                            Maryland                                            |
               |                                               M                                                |
               |                                                                                                |
               |                                                                                                |
               |                                                                                                |
               |                                                                                                |
               |                                     Delaware                                                   |
               |                                        D                                                       |
               |            Pennsylvania          Ohio                                                          |
               |                 P                 O                                                            |
           250 +                                                                                                +
               |                                           Illinois                                             |
               |                                              I                                     Florida     |
               |                                                                                       F        |
               |                              North Carolina             California                             |
               |                   New                   South               C                                  |
               |   West         Hampshire   Alabama N   Carolina                                                |
               | Virginia           N                T     S       G Georgia                                    |
               |    W           Mississippi       A Tennessee                  Washington Texas                 |
               |                     M  Vermont V    M Missouri    Oklahoma        W        T                   |
               |         South        Arkansas A    M Minnesota       O          Oregon                         |
               |         Dakota               I Idaho                    Nevada    O                            |
             0 +           S N North Dakota                                N                                    +
               ---+------------+------------+------------+------------+------------+------------+------------+---
                2000         3000         4000         5000         6000         7000         8000         9000