Language Reference
HEATMAPDISC Call
CALL HEATMAPDISC (x <*>COLORRAMP=ColorRamp <*>XVALUES=xValues<*>YVALUES=yValues<*>XAXISTOP=top<*>DISPLAYOUTLINES=outlines<*>TITLE=plotTitle<*>LEGENDTITLE=legendTitle<*>LEGENDLOC=loc <*>SHOWLEGEND=show <*>OTHER=other );
The HEATMAPDISC subroutine is part of the IMLMLIB library . The HEATMAPDISC subroutine displays a heat map of a numeric or character matrix whose values are assumed to have a small number of discrete values. The heat map is produced by calling the SGRENDER procedure to render a template, which is created at run time. The argument x is a matrix that contains numeric or character data. The ODS statistical graphics subroutines are described in Chapter 16: Statistical Graphics.
In addition to visualizing matrices with discrete values, you can use the HEATMAPDISC subroutine to visualize quantiles of a continuous variable.
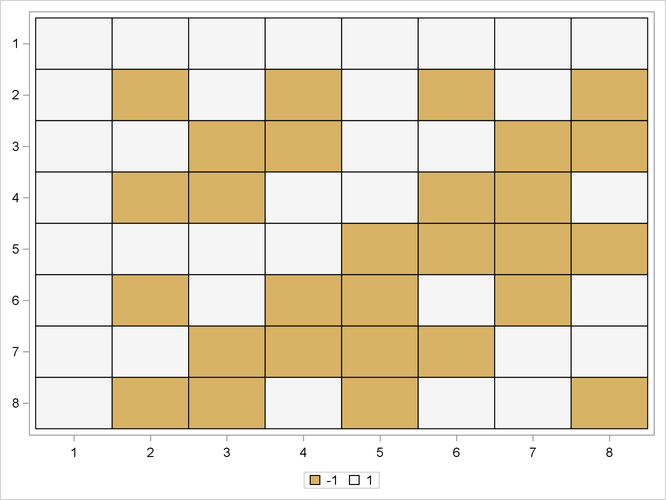
A simple example follows. The HADAMARD function generates an  matrix, each element is either 1 or
  . The HEATMAPDISC subroutine creates the image in Figure 25.159, which uses two colors to visualize the matrix.
h = hadamard(8);
run HeatmapDisc(h);
Figure 25.159: A Heat Map of a Matrix of Two Values
Specify the x vector inside parentheses and specify all options outside the parentheses. Titles are specified by using the TITLE= option. Each option corresponds to a statement or option in the graph template languge (GTL).
Except for the SCALE= option, the options for the HEATMAPDISC subroutine are the same as for the HEATMAPCONT subroutine .
You can use the PALETTE function to obtain colors from a wide variety of discrete color palettes.
By default, the row and column numbers of a matrix are used to label the heat map that is created by the HEATMAPDISC or HEATMAPCONT subroutine. The heat map is displayed in the same way that a matrix is printed: row 1 is at the top, row 2 is next, and so on. Columns increase from left to right. That means that the Y axis points down by default; the X axis points to the right.
Just as displaying a heat map is similar to printing a matrix, the XVALUES= and YVALUES= options are similar to the COLNAME= and ROWNAME= options (respectively) on the PRINT statement. You can use the XVALUES= and YVALUES= options to change the labels for the axes ticks, but these options do not change the values of the data. The following program shows a PRINT statement followed by a call to the HEATMAPDISC subroutine. The output is not shown, but in each case the printed output matches the graphical output.
m = {1 2 3, 4 5 6, 1 2 3, 4 5 6};
XLbl = char(1:ncol(m));
YLbl = char(1:nrow(m));

/* standard printing: row labels increase down the page */
print m[colname=XLbl rowname=YLbl];
run HeatmapDisc(m);  /* by default, axes labels are row/col numbers */

/* reverse Y labels; matrix is unchanged! */
Yrev = char(nrow(m):1);
print m[colname=XLbl rowname=Yrev];
run HeatmapDisc(m)   yvalues=Yrev;

/* to make the Y  axis point up, flip the rows and the labels */
r = m[nrow(m):1, ];
print r[colname=XLbl rowname=Yrev];
run HeatmapDisc(r)   yvalues=Yrev;