SGPLOT Procedure
- Syntax
 Procedure SyntaxPROC SGPLOT StatementBAND StatementBUBBLE StatementDENSITY StatementDOT StatementELLIPSE StatementHBAR StatementHBARPARM StatementHBOX StatementHIGHLOW StatementHISTOGRAM StatementHLINE StatementINSET StatementKEYLEGEND StatementLINEPARM StatementLOESS StatementNEEDLE StatementPBSPLINE StatementREFLINE StatementREG StatementSCATTER StatementSERIES StatementSTEP StatementVBAR StatementVBARPARM StatementVBOX StatementVECTOR StatementVLINE StatementWATERFALL (Preproduction) StatementXAXIS StatementX2AXIS StatementYAXIS StatementY2AXIS Statement
 - Overview
- Concepts
- Examples Grouping a Scatter PlotClustering a Grouped Scatter Plot Plotting Three SeriesAdding Prediction and Confidence Bands to a Regression PlotAdding a Prediction Ellipse to a Scatter PlotCreating Lines and Bands from Pre-Computed DataAdding Statistical Limits to a Dot PlotCombining Histograms with Density PlotsCreating a Horizontal Box PlotCreating a Bar-Line ChartCreating a High-Low Chart
HBOX Statement
Creates a horizontal box plot that shows the distribution
of your data.
| Interaction: | The HBOX statement cannot be used with other plot statements in the SGPLOT procedure. Box plots can be overlaid with other box plots. However, overlaid box plots must have the same category variables. |
| Examples: | About Box Plots |
Syntax
HBOX analysis-variable </ option(s)>;
Summary of Optional Arguments
Box options
specifies the width of the box.
specifies the shape of the whisker cap lines.
specifies that a connect line joins a statistic
from box to box.
specifies the appearance of the lines that connect
multiple boxes.
specifies an amount to offset all boxes from the
discrete tick marks.
specifies that the whiskers can extend to the maximum
and minimum values for the analysis variable, and that outliers are
not identified.
specifies whether the boxes are filled with color.
specifies the appearance of the fill for the boxes.
specifies the appearance of the box outlines.
specifies the appearance of the marker that represents
the mean in the box.
specifies the appearance of the line that represents
the median.
hides the cap lines for the whiskers.
hides the mean marker.
hides the median line.
hides the outliers from the plot.
specifies that the boxes be notched.
specifies the appearance of the marker that represents
the outliers.
specifies the appearance of the whisker and cap
lines.
Group options
specifies the cluster width as a ratio of the midpoint
spacing.
specifies a variable that is used to group the data.
specifies how to display grouped boxes.
specifies the ordering of boxes within a group.
Label options
adds data labels for the outlier markers.
specifies the appearance of the labels in the plot
when you use the DATALABEL= option.
specifies that only the far outliers have data labels.
Plot options
specifies the value of the ID variable in an attribute
map data set.
specifies the category variable for the plot.
specifies how many times observations are repeated
for computational purposes.
specifies a label that identifies the box plot in
the legend.
processes missing values as a valid category value
and creates a box for it.
specifies a name for the plot.
specifies a method for computing the percentiles
for the plot.
relocates outlier points that have identical values
to prevent overlapping.
specifies the degree of transparency for the plot.
assigns the analysis variable to the secondary (top)
horizontal axis.
assigns the analysis variable to the secondary (right)
vertical axis.
Optional Arguments
- ATTRID= variable
- specifies the value of the ID variable in an attribute map data set. You specify this option only if you are using an attribute map to control visual attributes of the graph. For more information, see Using SG Attribute Maps to Control Visual Attributes.
- BOXWIDTH= numeric-value
- specifies the width of the box. Specify a value between
0.0 (0% of the available width) and 1.0 (100% of the available width).Default:0.4
When GROUP is specified, the default box width is 0.6.
- CAPSHAPE= BRACKET | LINE | SERIF
- specifies the shape of the whisker cap lines. Specify one of the following values:
- CATEGORY= category-variable
- specifies the category variable for the plot. A box plot is created for each distinct value of the category variable.
- CLUSTERWIDTH= numeric-value
- specifies the cluster width as a ratio of the midpoint
spacing. Specify a value from
0.1 (narrowest) to 1.0 (widest).Default:0.7Interaction:This option is applicable only when a GROUP is in effect and the category axis is discrete.
- CONNECT= MEAN | MEDIAN | Q1 | Q3 | MIN | MAX
- specifies that a connect line joins a statistic
from box to box. Interaction:This option applies only when the CATEGORY option is used to generate multiple boxes.Tip:You can use the CONNECTATTRS option to specify attributes for the connect line.
- CONNECTATTRS= style-element <(options)> | (options)
- specifies the appearance of the lines that connect
multiple boxes. You can specify the
appearance by using a style element or by using suboptions. If you
specify a style element, you can also specify suboptions to override
specific appearance attributes.
- COLOR= color
-
specifies the color of the line. You can specify colors using the same color schemes that are supported by
SAS/GRAPH software. For more information, see Color-Naming Schemes in SAS/GRAPH: Reference.Default:For ungrouped data, the default color is specified by the ContrastColor attribute of the GraphConnectLine style element in the current style. For grouped data, the default color is specified by the ContrastColor attribute of the GraphData1 ... GraphDatan style elements in the current style.
- PATTERN= line-pattern
-
specifies the line pattern for the line. You can reference SAS patterns by number or by name. For a list of line patterns, see Line Patterns.Default:For ungrouped data, the default line pattern is specified by the LineStyle attribute of the GraphConnectLine style element in the current style. For grouped data, the default line pattern is specified by the LineStyle attribute of the GraphData1 ... GraphDatan style elements in the current style.
- THICKNESS= n <units>
-
specifies the thickness of the line. You can also specify the unit of measure. The default unit is pixels. For a list of measurement units that are supported, see Units of Measurement.Default:For ungrouped data, the default line thickness is specified by the LineThickness attribute of the GraphConnectLine style element in the current style. For grouped data, the default line thickness is specified by the LineThickness attribute of the GraphData1 ... GraphDatan style elements in the current style.
Default:The default style element is GraphConnectLine.Interactions:This option takes effect only if the CONNECT= option is also specified.This option is ignored if the GROUP= option is also specified.
- DATALABEL <= variable>
- adds data labels for the outlier markers. If you specified a
variable, then the values for that variable are used for the data
labels. If you did not specify a variable, then the values of the
analysis variable are used.Note:This option has no effect unless the plot contains outlier points.
- DATALABELATTRS= style-element <(options)> | (options)
- specifies the appearance of the labels in the plot
when you use the DATALABEL= option. You can specify the
appearance by using a style element or by using suboptions. If you
specify a style element, you can also specify suboptions to override
specific appearance attributes.
- COLOR= color
-
specifies the color of the label characters. You can specify colors using the same color schemes that are supported by
SAS/GRAPH software. For more information, see Color-Naming Schemes in SAS/GRAPH: Reference.Default:For ungrouped data, the default color is specified by the Color attribute of the GraphDataText style element in the current style. For grouped data, the default color is specified by the ContrastColor attribute of the GraphData1 ... GraphDatan style elements in the current style.
- FAMILY= “font-family”
-
specifies the font family for the label characters. The SAS ODS styles use TrueType system fonts. For more information, see TrueType Fonts Supplied by SAS in SAS Language Reference: Concepts.Default:The default font family is specified by the FontFamily attribute of the GraphDataText style element in the current style.
- SIZE= n <units>
-
specifies the font size of the label characters. You can also specify the unit of measurement. The default unit is pixels. For a list of measurement units that are supported, see Units of Measurement.Default:The default font size is specified by the FontSize attribute of the GraphDataText style element in the current style.
- STYLE= ITALIC | NORMAL
-
specifies whether the label characters are italic (ITALIC) or normal (NORMAL).Default:The default font style is specified by the FontStyle attribute of the GraphDataText style element in the current style.
- WEIGHT= BOLD | NORMAL
-
specifies whether the label characters are bold (BOLD) or normal (NORMAL).Default:The default font weight is specified by the FontWeight attribute of the GraphDataText style element in the current style.
Here is an example expression:DATALABELATTRS=(Color=Green Family=Arial Size=8 Style=Italic Weight=Bold)
Default:The default style element is GraphDataText.Interaction:This option has no effect unless the DATALABEL option is also specified.
- DISCRETEOFFSET= numeric-value
- specifies an amount to offset all boxes from the
discrete tick marks. Specify a
value from -0.5 (left offset) to +0.5 (right offset). If you specify
a value outside of this range, an error message appears in the SAS
log and the graph is not produced.Default:0.0 (no offset)
- EXTREME
- specifies that the whiskers can extend to the maximum and minimum values for the analysis variable, and that outliers are not identified. When you do not specify the EXTREME option, the whiskers cannot be longer than 1.5 times the length of the box.
- FILL | NOFILL
- specifies whether the boxes are filled with color. The FILL option shows
the fill color. The NOFILL option hides the fill color.Default:FILL
- FILLATTRS= style-element | (COLOR= color)
- specifies the appearance of the fill for the boxes. You
can specify the color of the fill by using a style element or by using
the COLOR= suboption. You
can specify colors using the same color schemes that are supported
by
SAS/GRAPH software. For more information, see Color-Naming Schemes in SAS/GRAPH: Reference.Default:For ungrouped data, the default color is specified by the Color attribute of the GraphDataDefault style element in the current style.For grouped data, the default color is specified by the ContrastColor attribute of the GraphData1 ... GraphDatan style elements in the current style.
Interaction:This option has no effect if you also specify the NOFILL option.
- FREQ= numeric-variable
- specifies how many times observations are repeated
for computational purposes. specifies that each
observation is repeated n times
for computational purposes, where n is
the value of the numeric variable. If n is
not an integer, then it is truncated to an integer. If n is
less than 1 or missing, then it is excluded from the analysis.Interaction:If your plot is overlaid with other categorization plots, then the first FREQ variable that you specified is used for all of the plots.
- GROUP= variable
- specifies a variable that is used to group the data. The plot elements for each group value are automatically distinguished by different visual attributes.
- GROUPDISPLAY= CLUSTER | OVERLAY
- specifies how to display grouped boxes.
- OVERLAY
-
all the boxes for a given group value are drawn at the exact coordinate and might overlap. Each group is represented by unique visual attributes derived from the GraphData1... GraphDatan style elements in the current style.
Default:CLUSTER for a discrete category axisOVERLAY for a linear axis
Restriction:GROUPDISPLAY=CLUSTER can take effect only when the category axis is discrete.Interaction:This option is ignored unless GROUP= is specified.
- GROUPORDER= ASCENDING | DESCENDING | DATA
- specifies the ordering of boxes within a group.
Interaction:This option is ignored unless GROUP= is specified.
- LABELFAR
- specifies that only the far outliers have data labels. Far outliers are points
whose distance from the box is more than three times the length of
the box.Note:This option has no effect if you do not specify the DATALABEL option, or if there are no far outliers.
- LEGENDLABEL= “text-string”
- specifies a label that identifies the box plot in the legend. By default, the label of the analysis variable is used.
- LINEATTRS= style-element <(options)> | (options)
- specifies the appearance of the box outlines. You can specify the
appearance by using a style element or by using suboptions. If you
specify a style element, you can also specify suboptions to override
specific appearance attributes.
For more information about style elements, see Style Elements for Use with ODS Graphics.
- COLOR= color
-
specifies the color of the line. You can specify colors using the same color schemes that are supported by
SAS/GRAPH software. For more information, see Color-Naming Schemes in SAS/GRAPH: Reference.Default:For ungrouped data, the default color is specified by the ContrastColor attribute of the GraphDataDefault style element in the current style. For grouped data, the default color is specified by the ContrastColor attribute of the GraphData1 ... GraphDatan style elements in the current style.
- PATTERN= line-pattern
-
specifies the line pattern for the line. You can reference SAS patterns by number or by name. For a list of line patterns, see Line Patterns.Default:For ungrouped data, the default line pattern is specified by the LineStyle attribute of the GraphDataDefault style element in the current style. For grouped data, the default line pattern is specified by the LineStyle attribute of the GraphData1 ... GraphDatan style elements in the current style.
- THICKNESS= n <units>
-
specifies the thickness of the line. You can also specify the unit of measure. The default unit is pixels. For a list of measurement units that are supported, see Units of Measurement.Default:For ungrouped data, the default line thickness is specified by the LineThickness attribute of the GraphDataDefault style element in the current style. For grouped data, the default line thickness is specified by the LineThickness attribute of the GraphData1 ... GraphDatan style elements in the current style.
Default: GraphDataDefault is the default style element.Interactions:This option takes effect only if the CONNECT= option is also specified.This option is ignored if the GROUP= option is also specified.
- MEANATTRS= style-element <(options)> | (options)
- specifies the appearance of the marker that represents
the mean in the box. You can specify the
appearance by using a style element or by using suboptions. If you
specify a style element, you can also specify suboptions to override
specific appearance attributes.
- COLOR= color
-
specifies the color of the markers. You can specify colors using the same color schemes that are supported by
SAS/GRAPH software. For more information, see Color-Naming Schemes in SAS/GRAPH: Reference.Default:For ungrouped data, the default color is specified by the ContrastColor attribute of the GraphBoxMean style element in the current style. For grouped data, the default color is specified by the ContrastColor attribute of the GraphData1 ... GraphDatan style elements in the current style.
- SIZE= n <units>
-
specifies the size of the markers. You can also specify the unit of measurement. The default unit is pixels. For a list of measurement units that are supported, see Units of Measurement.Default:The default marker size is specified by the MarkerSize attribute of the GraphBoxMean style element in the current style.
- SYMBOL= symbol-name
-
specifies the symbol for the markers. For a list of valid marker symbols, see Marker Symbols.Default:For ungrouped data, the default marker symbol is specified by the MarkerSymbol attribute of the GraphBoxMean style element in the current style. For grouped data, the default marker symbol is specified by the MarkerSymbol attribute of the GraphData1 ... GraphDatan style elements in the current style.
Default:GraphBoxMean is the default style element.
- MEDIANATTRS= style-element <(options)> | (options)
- specifies the appearance of the line that represents
the median. You can specify the
appearance by using a style element or by using suboptions. If you
specify a style element, you can also specify suboptions to override
specific appearance attributes.
- COLOR= color
-
specifies the color of the line. You can specify colors using the same color schemes that are supported by
SAS/GRAPH software. For more information, see Color-Naming Schemes in SAS/GRAPH: Reference.Default:For ungrouped data, the default color is specified by the ContrastColor attribute of the GraphBoxMedian style element in the current style. For grouped data, the default color is specified by the ContrastColor attribute of the GraphData1 ... GraphDatan style elements in the current style.
- PATTERN= line-pattern
-
specifies the line pattern for the line. You can reference SAS patterns by number or by name. For a list of line patterns, see Line Patterns.Default:For ungrouped data, the default line pattern is specified by the LineStyle attribute of the GraphBoxMedian style element in the current style. For grouped data, the default line pattern is specified by the LineStyle attribute of the GraphData1 ... GraphDatan style elements in the current style.
- THICKNESS= n <units>
-
specifies the thickness of the line. You can also specify the unit of measure. The default unit is pixels. For a list of measurement units that are supported, see Units of Measurement.Default:For ungrouped data, the default line thickness is specified by the LineThickness attribute of the GraphBoxMedian style element in the current style. For grouped data, the default line thickness is specified by the LineThickness attribute of the GraphData1 ... GraphDatan style elements in the current style.
Default: GraphBoxMedian is the default style element.Interaction:This option is ignored if the NOMEDIAN option is also specified.
- NAME= “text-string”
- specifies a name for the plot. You can use the name
to refer to this plot in other statements.Note:The name is case-sensitive. When you refer to the specified name in other statements, you must use the same exact capitalization.
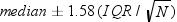
- NOTCHES
- specifies that the boxes be notched. The endpoints of the
notches are at the following computed locations:
For a visual description of the parts of a box plot, see Details.
- OUTLIERATTRS= style-element <(options)> | (options)
- specifies the appearance of the marker that represents
the outliers. You can specify the
appearance by using a style element or by using suboptions. If you
specify a style element, you can also specify suboptions to override
specific appearance attributes.
- COLOR= color
-
specifies the color of the markers. You can specify colors using the same color schemes that are supported by
SAS/GRAPH software. For more information, see Color-Naming Schemes in SAS/GRAPH: Reference.Default:For ungrouped data, the default color is specified by the ContrastColor attribute of the GraphOutlier style element in the current style. For grouped data, the default color is specified by the ContrastColor attribute of the GraphData1 ... GraphDatan style elements in the current style.
- SIZE= n <units>
-
specifies the size of the markers. You can also specify the unit of measurement. The default unit is pixels. For a list of measurement units that are supported, see Units of Measurement.Default:The default marker size is specified by the MarkerSize attribute of the GraphOutlier style element in the current style.
- SYMBOL= symbol-name
-
specifies the symbol for the markers. For a list of valid marker symbols, see Marker Symbols.Default:For ungrouped data, the default marker symbol is specified by the MarkerSymbol attribute of the GraphOutlier style element in the current style. For grouped data, the default marker symbol is specified by the MarkerSymbol attribute of the GraphData1 ... GraphDatan style elements in the current style.
Default:GraphOutlier is the default style element.
- PERCENTILE= 1 | 2 | 3 | 4 | 5
- specifies a method for computing the percentiles
for the plot. For
descriptions of each method, see “Calculating Percentiles”
in the UNIVARIATE Procedure chapter of Base SAS Procedures
Guide: Statistical Procedures.Default:5
- SPREAD
- relocates outlier points that have identical values
to prevent overlapping. Note:This option has no effect if your data does not contain two or more outliers with identical values for the analysis variable.
- TRANSPARENCY= value
- specifies the degree of transparency for the plot. Specify a value from
0.0 (completely opaque) to 1.0 (completely transparent).Default:0.0
- WHISKERATTRS= style-element <(options)> | (options)
- specifies the appearance of the whisker and cap
lines. You can specify the
appearance by using a style element or by using suboptions. If you
specify a style element, you can also specify suboptions to override
specific appearance attributes.
- COLOR= color
-
specifies the color of the line. You can specify colors using the same color schemes that are supported by
SAS/GRAPH software. For more information, see Color-Naming Schemes in SAS/GRAPH: Reference.Default:For ungrouped data, the default color is specified by the ContrastColor attribute of the GraphBoxWhisker style element in the current style. For grouped data, the default color is specified by the ContrastColor attribute of the GraphData1 ... GraphDatan style elements in the current style.
- PATTERN= line-pattern
-
specifies the line pattern for the line. You can reference SAS patterns by number or by name. For a list of line patterns, see Line Patterns.Default:For ungrouped data, the default line pattern is specified by the LineStyle attribute of the GraphBoxWhisker style element in the current style. For grouped data, the default line pattern is specified by the LineStyle attribute of the GraphData1 ... GraphDatan style elements in the current style.
- THICKNESS= n <units>
-
specifies the thickness of the line. You can also specify the unit of measure. The default unit is pixels. For a list of measurement units that are supported, see Units of Measurement.Default:For ungrouped data, the default line thickness is specified by the LineThickness attribute of the GraphBoxWhisker style element in the current style. For grouped data, the default line thickness is specified by the LineThickness attribute of the GraphData1 ... GraphDatan style elements in the current style.
Default:GraphBoxWhisker is the default style element.Interaction:This option is ignored if the NOMEDIAN option is also specified.
Details
Horizontal
and vertical box plots display the distribution of data by using a
rectangular box and whiskers. Whiskers are lines that indicate a data
range outside of the box.
Note: Though the following figure
shows a vertical box plot, the basic concepts apply to horizontal
box plots.
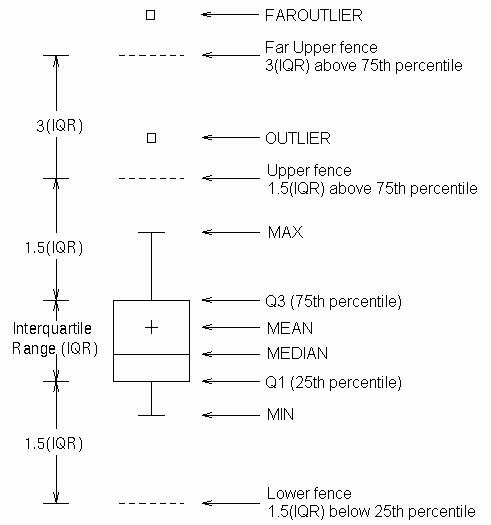
Parts of a Box Plot shows a diagram of a vertical box plot. The bottom and
top edges of the box indicate the intra-quartile range (IQR). That
is, the range of values between the first and third quartiles (the
25th and 75th percentiles). The marker inside the box indicates the
mean value. The line inside the box indicates the median value.
The elements that are
outside the box are dependent on your options. By default, the whiskers
that extend from each box indicate the range of values that are outside
of the intra-quartile range. However, they are close enough not to
be considered outliers (a distance less than or equal to 1.5*IQR).
If you specify the EXTREME option, then the whiskers indicate the
entire range of values, including outliers.
Any points that are
a distance of more than 1.5*IQR from the box are considered to be
outliers. By default, these points are indicated by markers. If you
specify DATALABEL= option, then the outlier points have data labels.
If you also specify the LABELFAR option, then only outliers that are
3*IQR from the box have data labels.