SGPLOT Procedure
- Syntax
 Procedure SyntaxPROC SGPLOT StatementBAND StatementBUBBLE StatementDENSITY StatementDOT StatementELLIPSE StatementHBAR StatementHBARPARM StatementHBOX StatementHIGHLOW StatementHISTOGRAM StatementHLINE StatementINSET StatementKEYLEGEND StatementLINEPARM StatementLOESS StatementNEEDLE StatementPBSPLINE StatementREFLINE StatementREG StatementSCATTER StatementSERIES StatementSTEP StatementVBAR StatementVBARPARM StatementVBOX StatementVECTOR StatementVLINE StatementWATERFALL (Preproduction) StatementXAXIS StatementX2AXIS StatementYAXIS StatementY2AXIS Statement
 - Overview
- Concepts
- Examples Grouping a Scatter PlotClustering a Grouped Scatter Plot Plotting Three SeriesAdding Prediction and Confidence Bands to a Regression PlotAdding a Prediction Ellipse to a Scatter PlotCreating Lines and Bands from Pre-Computed DataAdding Statistical Limits to a Dot PlotCombining Histograms with Density PlotsCreating a Horizontal Box PlotCreating a Bar-Line ChartCreating a High-Low Chart
YAXIS Statement
Specifies the axis options for the Y axis. You can
control the features of the axis (for example, the axis label, grid
lines, and minor tick marks). You can also control the structure
of the axis (for example, the data range, data type, and tick mark
values).
Syntax
YAXIS option(s);
Summary of Optional Arguments
Axis options
specifies the order in which discrete tick values
are placed on the axis.
specifies which features of the axis are displayed.
creates grid lines at each tick on the axis.
specifies that only integers are used for tick mark
values.
specifies the tick interval for a time axis.
specifies a label for the axis.
specifies the appearance of the axis labels.
specifies the base value for the logarithmic scale.
specifies how to scale and format the values for
the major tick marks for logarithmic axes.
specifies the maximum value for the axis.
specifies the minimum value for the axis.
adds minor tick marks to a log or time axis.
prevents a time axis from splitting the time, date,
or datetime values into two rows.
specifies an offset that follows the highest data
value on the axis.
specifies an offset that precedes the lowest data
value on the axis.
adds tick marks to axis that is opposite from the
specified axis.
specifies that the tick values are displayed in
reverse (descending) order.
Specifies a threshold for displaying one more tick
mark at the high end of the axis.
Specifies a threshold for displaying one more tick
mark at the low end of the axis.
specifies the format for the axis tick values.
specifies the type of axis.
specifies the appearance of the axis tick value
labels.
specifies the values for the ticks on an axis.
specifies that the minimum and maximum axis values
are determined independently of the values that you specify in the
VALUES= option.
Optional Arguments
- DISCRETEORDER= DATA | FORMATTED | UNFORMATTED
- specifies the order in which discrete tick values
are placed on the axis. Specify one of the
following values:
Default:UNFORMATTEDRestriction:This option affects only box plots, dot plots, bar charts, and line plots, or for any axis where TYPE=DISCRETE.
- DISPLAY= ALL | NONE | (options)
- specifies which features of the axis are displayed. ALL displays all of
the features of the axis. NONE specifies that none of the features
of the axis are displayed. You can also hide specific features:
Default:ALL
- INTEGER
- specifies that only integers are used for tick mark values. This option affects only linear axes.
- INTERVAL= interval-value
- specifies the tick interval for a time axis. Specify one of the
following values:
- SEMIMONTH
-
places ticks at the first and sixteenth day of each month. The default tick value format is DATE9.
Default:AUTO
- LABELATTRS= style-element <(options)> | (options)
- specifies the appearance of the axis labels. You can specify the
appearance by using a style element or by using suboptions. If you
specify a style element, you can also specify suboptions to override
specific appearance attributes.
- COLOR= color
-
specifies the color of the label characters. You can specify colors using the same color schemes that are supported by
SAS/GRAPH software. For more information, see Color-Naming Schemes in SAS/GRAPH: Reference.Default:For ungrouped data, the default color is specified by the Color attribute of the GraphLabelText style element in the current style. For grouped data, the default color is specified by the ContrastColor attribute of the GraphData1 ... GraphDatan style elements in the current style.
- FAMILY= “font-family”
-
specifies the font family for the label characters. The SAS ODS styles use TrueType system fonts. For more information, see TrueType Fonts Supplied by SAS in SAS Language Reference: Concepts.Default:The default font family is specified by the FontFamily attribute of the GraphLabelText style element in the current style.Restriction:You cannot specify a list of font family names.
- SIZE= n <units>
-
specifies the font size of the label characters. You can also specify the unit of measurement. The default unit is pixels. For a list of measurement units that are supported, see Units of Measurement.Default:The default font size is specified by the FontSize attribute of the GraphValueText style element in the current style.
- STYLE= ITALIC | NORMAL
-
specifies whether the label characters are italic or normal.Default:The default font style is specified by the FontStyle attribute of the GraphLabelText style element in the current style.
- WEIGHT= BOLD | NORMAL
-
specifies whether the label characters are bold or normal.Default:The default font weight is specified by the FontWeight attribute of the GraphLabelText style element in the current style.
Interaction:This option has no effect unless CURVELABEL is also specified.
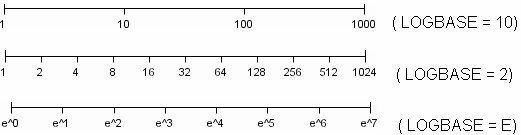
- LOGBASE= 2 | 10 | e
- specifies the base value for the logarithmic scale. Default:10Interaction:This option has no effect unless you also specify TYPE=LOG.
- LOGSTYLE= LINEAR | LOGEXPAND | LOGEXPONENT
- specifies how to scale and format the values for
the major tick marks for logarithmic axes. Specify one of the
following values:
- LOGEXPAND
-
places the tick marks at integer powers of the base. For example, if you specified
LOGBASE=2, the tick marks might be at 1, 2, 4, 8, 16. See Graph Axes with LOGEXPAND.
- LOGEXPONENT
-
places the tick marks at integer powers of the base, but identifies the values by the exponent. For example, if you specified
LOGBASE=10, the tick marks might be at 1, 10, 100, 1000, but the tick values would read 0, 1, 2, 3. See An Axis with LOGEXPONENT.
- LINEAR
-
places the tick marks at uniform linear intervals, but spaces them logarithmically. In some cases an intermediate tick mark is placed between the first and second marks.For example, if the data on this axis range from 14 to 1154, and you specify
LOGBASE=10, then the tick marks might be at 10, 40, 200, 400, 600, 800, 1000, 1200. See An Axis with LINEAR.
Default:LOGEXPANDInteraction:This option has no effect unless you also specify TYPE=LOG.


- MAX= numeric-value
- specifies the maximum value for the axis. Restriction:This option affects linear, log, and time axes only.Interaction:This option has no effect if you specify the VALUES= option and you do not also specify the VALUESHINT option.
- MIN= numeric-value
- specifies the minimum value for the axis. Restriction:This option affects linear, log, and time axes only.Interaction:This option has no effect if you specify the VALUES= option and you do not also specify the VALUESHINT option.
- MINOR
- adds minor tick marks to a log or time axis. Restriction:This option has no effect on linear or discrete axes.Interaction:This option has no effect if you specify the VALUES= option.
- NOTIMESPLIT
- prevents a time axis from splitting the time, date,
or datetime values into two rows. Restriction:This option applies to time axes only.
- OFFSETMAX= numeric-value
- specifies an offset that follows the highest data
value on the axis. Specify a value between
0 and 1.The value represents the offset as a proportion to the total length of the axis. For a continuous axis, the offset follows the highest data value or highest tick value, whichever is greater. For a discrete axis, the offset is applied to the end of the axis farther from the axis origin.Default:The offset space is determined automatically based on the data values, tick mark values, markers, and labels that are inside of the plot area.Interaction:For HBOX, HBAR, HLINE, and DOT plot statements, the Y axis is reversed by default, so the axis origin is at the top. For these plots, OFFSETMAX= creates an offset at the end of the Y axis nearer to the origin.
- OFFSETMIN= numeric-value
- specifies an offset that precedes the lowest data
value on the axis. Specify a value between
0 and 1.The value represents the offset as a proportion to the total length of the axis. For a continuous axis, the offset precedes the lowest data value or lowest tick value, whichever is less. For a discrete axis, the offset is applied to the end of the axis nearer to the axis origin.Default:The offset space is determined automatically based on the data values, tick mark values, markers, and labels that are inside of the plot area.Interaction:For HBOX, HBAR, HLINE, and DOT plot statements, the Y axis is reversed by default, so the axis origin is at the top. For these plots, OFFSETMIN= creates an offset at the end of the Y axis farther from the origin.
- REFTICKS
- adds tick marks to axis that is opposite from the
specified axis. For example, if you
specify the REFTICKS option in the XAXIS statement, then tick marks
are added to the X2 axis. Note:This option has no effect if the target axis already contains data.
- THRESHOLDMAX= numeric-value
- Specifies a threshold for displaying one more tick mark at the high end of the axis.
- THRESHOLDMIN= numeric-value
- Specifies a threshold for displaying one more tick mark at the low end of the axis.
- TICKVALUEFORMAT= DATA | SAS-format
- specifies the format for the axis tick values. You can either specify a SAS format or specify DATA, which indicates that the format from the axis variable is used.
- TYPE= DISCRETE | LINEAR | LOG | TIME
- specifies the type of axis. Specify one of the
following values:
- DISCRETE
-
specifies an axis with discrete values. If a character variable is assigned to an axis, then the default type for that axis is discrete. In addition, all categorization plots use a discrete axis for the category variable.
- LINEAR
-
specifies a linear scale for the axis. This is the default axis type for numeric variables, except when the data is discrete or when the numeric variable has a date or time format.
- VALUEATTRS= style-element <(options)> | (options)
- specifies the appearance of the axis tick value
labels. You can specify the
appearance by using a style element or by using suboptions. If you
specify a style element, you can also specify suboptions to override
specific appearance attributes.
- COLOR= color
-
specifies the color of the label characters. You can specify colors using the same color schemes that are supported by
SAS/GRAPH software. For more information, see Color-Naming Schemes in SAS/GRAPH: Reference.Default:For ungrouped data, the default color is specified by the Color attribute of the GraphValueText style element in the current style. For grouped data, the default color is specified by the ContrastColor attribute of the GraphData1 ... GraphDatan style elements in the current style.
- FAMILY= “font-family”
-
specifies the font family for the label characters. The SAS ODS styles use TrueType system fonts. For more information, see TrueType Fonts Supplied by SAS in SAS Language Reference: Concepts.Default:The default font family is specified by the FontFamily attribute of the GraphValueText style element in the current style.Restriction:You cannot specify a list of font family names.
- SIZE= n <units>
-
specifies the font size of the label characters. You can also specify the unit of measurement. The default unit is pixels. For a list of measurement units that are supported, see Units of Measurement.Default:The default font size is specified by the FontSize attribute of the GraphValueText style element in the current style.
- VALUES= ( values-list )
- specifies the values for the ticks on an axis.
- value <...value-n>
-
creates ticks for specific values. For example,
VALUES= (0 50 100)places tick marks at 0, 50, and 100.
- value-1 TO value-2 BY increment-value
-
creates ticks for a range of values. The start of the value range is specified by value-1 and the end of the range is specified by value-2. The increment-value specifies the interval between the ticks. For example,
VALUES= (0
                                       to 100 by 50)
creates tick marks at 0, 50, and 100.
- <value ... value-n>value-1 TO value-2 BY increment-value <value ... value-n>
-
creates ticks for specific values, and also creates ticks for a range of values. The start of the value range is specified by value-1 and the end of the range is specified by value-2. The increment-value specifies the interval between the ticks.
- value <...value-n>
-
creates ticks for specific values. For example,
VALUES= ("25MAY08"d "04JUL08"d "23AUG08"d)places tick marks at 25MAY08, 04JUL08, and 23AUG08.
- value-1 TO value-2 BY increment-value
-
creates ticks for a range of values. The start of the value range is specified by value-1 and the end of the range is specified by value-2. The increment-value specifies the interval between the ticks. For example,
VALUES= ("01JAN08"d
                                       to "01MAY08"d by month)
creates tick marks at 01JAN08, 01FEB08, 01MAR08, 01APR08, and 01MAY08.
Restrictions:This option has no effect on discrete and logarithmic axes.If your VALUES= option creates more than 1000 values, then the option has no effect.
Interaction:If a custom format is applied to the value, the raw value is plotted first and then formatted.
- VALUESHINT
- specifies that the minimum and maximum axis values
are determined independently of the values that you specify in the
VALUES= option. The values from the
VALUES= option are displayed only if they are located between the
minimum and maximum values.Interaction:This option has no effect unless you also specify the VALUES= option.