SGPLOT Procedure
- Syntax
 Procedure SyntaxPROC SGPLOT StatementBAND StatementBUBBLE StatementDENSITY StatementDOT StatementELLIPSE StatementHBAR StatementHBARPARM StatementHBOX StatementHIGHLOW StatementHISTOGRAM StatementHLINE StatementINSET StatementKEYLEGEND StatementLINEPARM StatementLOESS StatementNEEDLE StatementPBSPLINE StatementREFLINE StatementREG StatementSCATTER StatementSERIES StatementSTEP StatementVBAR StatementVBARPARM StatementVBOX StatementVECTOR StatementVLINE StatementWATERFALL (Preproduction) StatementXAXIS StatementX2AXIS StatementYAXIS StatementY2AXIS Statement
 - Overview
- Concepts
- Examples Grouping a Scatter PlotClustering a Grouped Scatter Plot Plotting Three SeriesAdding Prediction and Confidence Bands to a Regression PlotAdding a Prediction Ellipse to a Scatter PlotCreating Lines and Bands from Pre-Computed DataAdding Statistical Limits to a Dot PlotCombining Histograms with Density PlotsCreating a Horizontal Box PlotCreating a Bar-Line ChartCreating a High-Low Chart
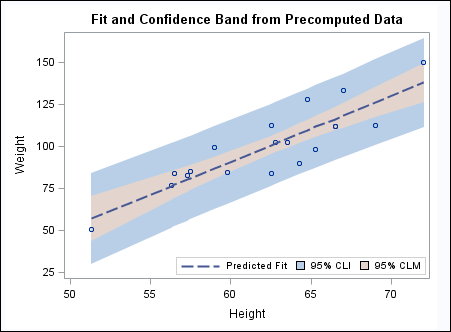
Example 6: Creating Lines and Bands from Pre-Computed Data
| Features: |
BAND statement KEYLEGEND statement SCATTER statement SERIES statement |
| Sample library member: | SGPLBND |
This example shows
how to use pre-computed data to create a scatter plot, fit line, and
confidence bands. The data set was created by the REG procedure. This
technique is useful for more complex fit models.
Program
proc sgplot data=sashelp.classfit;
  title "Fit and Confidence Band from Precomputed Data";
  band x=height lower=lower upper=upper /
       legendlabel="95% CLI" name="band1";
  band x=height lower=lowermean upper=uppermean /
       fillattrs=GraphConfidence2
       legendlabel="95% CLM" name="band2";
  scatter x=height y=weight;
  series x=height y=predict / lineattrs=GraphPrediction
         legendlabel="Predicted Fit" name="series";
  keylegend "series" "band1" "band2" / location=inside
position=bottomright;
run;
title;
Program Description
Set the title and create the first band plot. The LEGENDLABEL= option in the BAND statement specifies
the label for the band plot in the legend.
proc sgplot data=sashelp.classfit;
  title "Fit and Confidence Band from Precomputed Data";
  band x=height lower=lower upper=upper /
       legendlabel="95% CLI" name="band1";
Create the second band plot. The
LEGENDLABEL= option specifies the label for the band plot in the legend.
The FILLATTRS= option specifies the style element for the fill.
  band x=height lower=lowermean upper=uppermean /
       fillattrs=GraphConfidence2
       legendlabel="95% CLM" name="band2";
  scatter x=height y=weight;
  series x=height y=predict / lineattrs=GraphPrediction
         legendlabel="Predicted Fit" name="series";
Create the scatter and series plots. The LINEATTRS= option in the SERIES statement specifies
the style attribute for the series plot. The LEGENDLABEL= option in
the SERIES statement specifies the legend label for the series plot.