SGPLOT Procedure
Example 1: Grouping a Scatter Plot
| Features: |
SCATTER statement
|
| Sample library member: |
SGPLSCT |
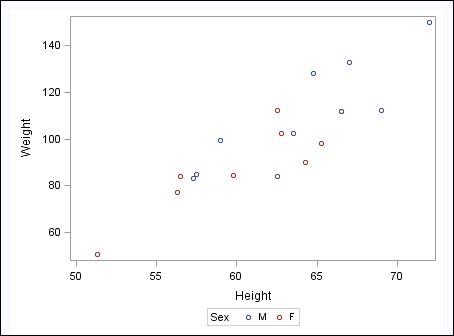
This example shows
a simple scatter plot with grouped data.
Program
proc sgplot data=sashelp.class;
  scatter x=height y=weight / group=sex;
run;
Program Description
Create the scatter plot. In
the SCATTER statement, the GROUP= option groups the data by the SEX
variable.
proc sgplot data=sashelp.class;
  scatter x=height y=weight / group=sex;
run;
Copyright © SAS Institute Inc. All rights reserved.
 Procedure SyntaxPROC SGPLOT StatementBAND StatementBUBBLE StatementDENSITY StatementDOT StatementELLIPSE StatementHBAR StatementHBARPARM StatementHBOX StatementHIGHLOW StatementHISTOGRAM StatementHLINE StatementINSET StatementKEYLEGEND StatementLINEPARM StatementLOESS StatementNEEDLE StatementPBSPLINE StatementREFLINE StatementREG StatementSCATTER StatementSERIES StatementSTEP StatementVBAR StatementVBARPARM StatementVBOX StatementVECTOR StatementVLINE StatementWATERFALL (Preproduction) StatementXAXIS StatementX2AXIS StatementYAXIS StatementY2AXIS Statement