Changing the Properties of a Network Graph
Change the Properties of a Network Graph
The properties
of a network graph determine features such as colors, line widths
for links, the layout algorithm used for the graph, and behavior of
the lens tool.
Note: Any changes
that you make to a graph's properties remain in effect only while
the current project is open. If you close and then reopen the project,
the properties revert to their default values.
Graph Tab
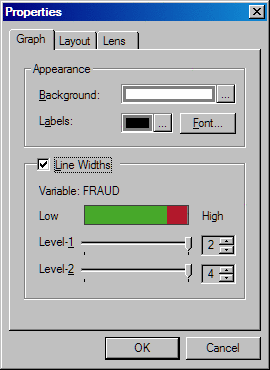
You can select the
background color for the graph and the color that is used for graph
labels. Click the color selection buttons  for Background and Labels to open the Color dialog box for each. The Color
dialog box contains colors to choose from and the option to define
your own color. For help using the Color dialog box, see Using the Color Dialog Box.
for Background and Labels to open the Color dialog box for each. The Color
dialog box contains colors to choose from and the option to define
your own color. For help using the Color dialog box, see Using the Color Dialog Box.
for Background and Labels to open the Color dialog box for each. The Color
dialog box contains colors to choose from and the option to define
your own color. For help using the Color dialog box, see Using the Color Dialog Box. By default, all links
are one pixel in width. Select the Line Width check box to set up to three different link widths.
This section uses a
color spectrum to display the link colors, and lists the variable
that is used to determine those colors. (You set this variable in
the Edit Data Attributes dialog box. See Specify Data Attributes.)
Use the sliders to
set the boundaries between the different line width levels. Use the
arrows to the right of the list boxes to increase or decrease the
width of the lines. The Level-1 and Level-2 sliders enable you to set two line-width levels
for particular link colors. As you drag a slider across the color
spectrum, the respective links change the width of their lines.
Layout Tab
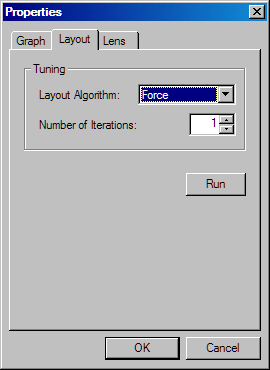
Regardless
of the layout pattern you are using for a graph, you can fine tune
the layout by adjusting its layout tuning algorithm. A layout tuning
algorithm adjusts the current node layout in a prescribed manner in
an attempt to create a more visually useful layout. When you first
create a network graph, you might not know which layout algorithm
is best for your graph, so it’s often helpful to explore the
available algorithms.
Click Run to apply the algorithm to your graph. You can run
the algorithm multiple times to see different layouts. The Force algorithm
typically changes the layout each time you click Run.
The Swap
algorithm might or might not change the layout when you click Run, depending on the following factors:
Note: After you click Run, any changes made to the layout cannot be undone
by clicking the Cancel button. However, the Cancel button cancels all other changes made in the
properties dialog box.
For information about
the layout patterns available for network graphs, see About Network Graphs. To
change a graph's layout pattern, see Change the Layout of a Network Graph.
Lens Tab
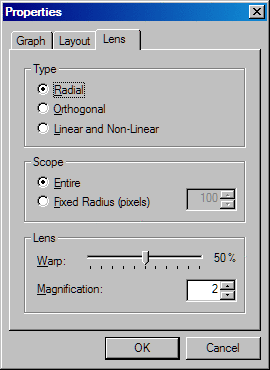
The Lens tab enables you to set properties for the lens
tool, which transforms (magnifies and warps) the region of the graph
near the cursor. The Lens tab contains the
following items:
Select the type of
transformation that the lens tool uses:
-
Linear and Non-Linear combines two types of transformations into one lens. The points closest to the cursor are zoomed using a linear transformation (all are moved the same amount). The points farther away from the cursor are scaled using a nonlinear technique. The effect is that the farther away the point is from the cursor, the less zoom it gets. Changing the Fixed Radius value controls where the demarcation line is between the linear and the nonlinear transformation.
Select a button to
set the range of the transformation from the center of focus. This
setting controls the size of the lens. Select Entire if you want the warped portion to cover the entire graph. Select Fixed Radius to specify in pixels the portion of the
graph that is to be warped. The default value is 100 pixels. If you
select a Linear or Non-Linear lens type,
then Fixed Radius is the only option available.