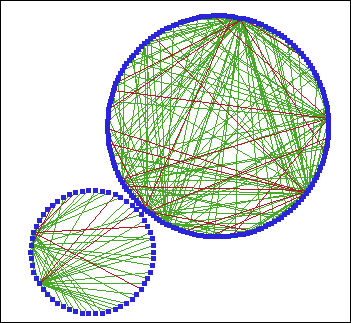
About Network Graphs

A network graph uses information from both the link and node data sets to generate a graphical depiction of the network.
The nodes and links in a network graph can be arranged in a variety of layout patterns. You can choose from the following patterns:
  • Circular: the application sequentially assigns all the connected nodes in the network within a circle.
    Here is an example of a circular layout:
    Circular Layout
    Circular network graph
  • Hierarchical: The application constructs a tree-like depiction of the network, and places nodes with more connecting links closer to the center.
    Here is an example of a hierarchical layout:
    Hierarchical Layout
    Hierarchical network graph
  • Hexagonal: The application sequentially chooses nodes and attempts to distribute them evenly across one or more hexagons.
    Here is an example of a hexagonal layout:
    Hexagonal Layout
    Hexagonal network graph
  • Multi-level force-directed: The application combines graph partitioning and spring or force-directed layout heuristics to determine node positions.
    Here is an example of a multi-level force layout:
    Multi-Level Force-Directed Layout
    Multi-level force network graph
  • Fixed position: The application arranges nodes according to (x; y) coordinates that you supply with a SAS data set.
    Here is an example of a fixed position layout:
    Fixed Position Layout
    Fixed position network graph
    For information about the position data set, see Creating a Positions File for a Fixed Position Network Graph.
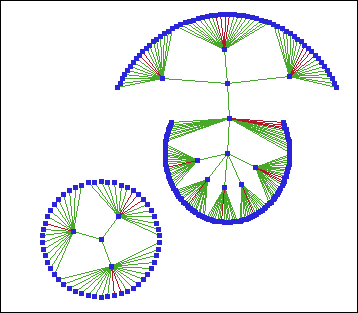
You choose the initial layout pattern when you create the graph. Depending on the nature of the data, your choice of layout pattern can greatly affect the insight you can glean from the visualization of your network. Because you might not initially be aware of any underlying structure in your data, it can be helpful to try multiple layout patterns to determine which are the most useful for the network being investigated. After creating the graph, you can later change its layout.
Once you have created a network graph, you can analyze graph data in the following ways:
  • Select individual observations or groups of observations in order to focus on a subset of the data. You can then analyze selected links, nodes, or both. For details about selecting data, see Selecting the Data That Appears in Graphs.
  • Use statistical graphs to subset the data that is displayed. For example, you can create a scatter plot based on node data and then select some of the markers in the scatter plot. When you select markers in the scatter plot, the network graph is updated to show only the nodes that correspond to the markers you selected.
  • Use a local selection mode to graphically subset data at multiple levels. For more information, see Understanding Selection Mode.
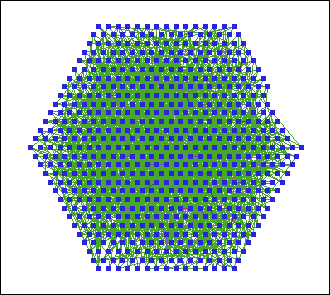
  • Regardless of the layout pattern you are using for a graph, you can fine tune the layout by adjusting its layout tuning algorithm. You can make this adjustment when you set the graph's properties.
  • Use the tools available to manipulate the graphs. For example, you can zoom in on a portion of a graph or apply a magnifying lens to a network graph. You can also show the labels for particular nodes in a network graph.
You might want to change the appearance and behaviors associated with a graph by changing the graph's properties. The properties of a network graph determine features such as colors, line widths for links, the layout algorithm used for the graph, and the behavior of the lens tool.
SAS/GRAPH Network Visualization Workshop assigns colors to nodes and links based on user-designated variables in the respective node and link data sets. In addition, you can assign different shapes to the nodes based on a user-designated variable in the node data set. You can assign these variables using the Edit Data Attributes dialog box. For details, see Specify Data Attributes.