By default,
when you select an observation in a graph or data table, that observation
is automatically selected in all graphs and data tables associated
with the project. You can change the default behavior so that a selection
is limited to the graph or data table in which the selection is made.
SAS/GRAPH
Network Visualization Workshop supports two selection modes:
|
|
The default mode.
All data views (graphs and data tables) share a common observation
selection state.
Global selection mode enables you
to graphically subset data at a single level. Suppose you have three
graphs: A, B, and C. Selecting a subset of the observations in graph
A causes graphs B and C to treat that same subset as selected.
|
|
|
Each data view
has a private observation selection state. When you select an observation
in a graph or data table, the observation is marked as selected only
for that view.
Local selection mode enables you to graphically subset data at multiple
levels. Suppose you have three graphs: A, B, and C. You can select
some observations in graph A, and then select different observations
in graph B. Finally, you can configure graph C to display either the
union or the intersection of the selections made in graphs A and B.
|
While
in local selection mode, a graph operates in one of two roles:
-
Selector role: A view that has
a selector role enables you to manually select observations. When
you select an observation, the observation is marked as selected only
for that view.
-
Observer role: A view that has
an observer role does not allow you to select observations. An observer
view treats an observation as selected based on the observation's
selection state in the selector views and on the observer view's scheme.
There are two observer view schemes:
-
The union scheme treats
an observation as selected if the observation is selected in any of
the selector views.
-
The intersection scheme
treats an observation as selected if the observation is selected in
all of the selector views.
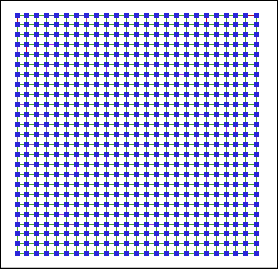
The following
display shows an example of a fixed position network visualization
using the Computer Grid sample data.
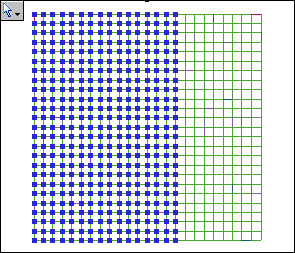
The following
display shows two additional network graphs of the same data. Here
are the characteristics of these network graphs:
-
Local selection mode has been applied.
-
Both of these graphs have been
changed to a selector role, as indicated by the icon in the upper
left corner.
-
Different observations are selected
for each network graph, though there is some overlap (intersection).
Note: All tables
and any statistical graphs that are open have been changed to observer
role. They do not participate in the selection of data.
Some data selected
in a network graph
|
|
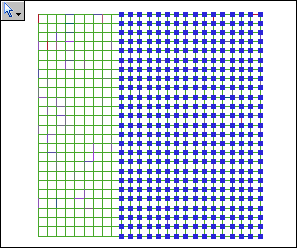
Different data
selected in another network graph
|
|
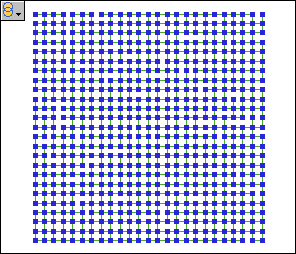
The following
display shows the union and the intersection of the selected data.