GKPI Procedure

Example 2: Creating a Gray Scale Bullet Graph
| Features: |
PROC GKPI statement option: MODE=RAISED
|
| Sample library member: | GKPGRBUL |
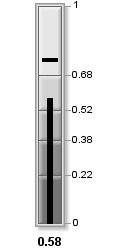
This example creates
a vertical bullet graph. It uses a gray scale color scheme that provides
a good contrast between ranges. This color scheme can be used in output
that is included in publications that are not in color.
Program
goptions reset=all device=javaimg xpixels=130 ypixels=250;
proc gkpi mode=raised;
vbullet
   actual=.58  bounds=(0 .22 .38 .52 .68 1) / target=.75
   colors=(cx747474 cx8C8C8C cxB2B2B2 cxD2D2D2 cxE6E6E6);
run;
quit;
Program Description
Set the graphics environment.Use the XPIXELS and YPIXELS options in the GOPTIONS statement to
scale the KPI charts to a size that would be appropriate for use in
a dashboard.
Generate the KPI chart. Specify
the range boundaries, actual KPI value, target value, and colors.
The gray scale colors are specified using hexadecimal RGB values.
proc gkpi mode=raised;
vbullet
   actual=.58  bounds=(0 .22 .38 .52 .68 1) / target=.75
   colors=(cx747474 cx8C8C8C cxB2B2B2 cxD2D2D2 cxE6E6E6);
run;