GKPI Procedure

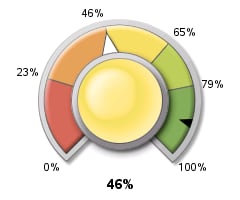
Example 3: Creating a Dial KPI Chart
| Features: |
PROC GKPI statement option: MODE=RAISED
|
| Sample library member: | GKPDIAL |
Program
goptions reset=all device=javaimg xpixels=240 ypixels=200;
proc gkpi mode=raised;
dial actual=.46 bounds=(0 .23 .46 .65 .79 1) /
   target=.9  nolowbound  format="percent8.0"
   afont=(f="Albany AMT" height=.5cm)
   bfont=(f="Albany AMT" height=.4cm) ;
run;
quit;
Program Description
Set the graphics environment.Use the XPIXELS and YPIXELS options in the GOPTIONS statement to
scale the KPI charts to a size that would be appropriate for use in
a dashboard.
Generate the KPI chart. Specify
the range boundaries, actual KPI value, and target value. In this
case, the target value falls on a range boundary. The NOLOWBOUNDARY
option specifies that the KPI chart behaves as if the actual KPI value
falls in the higher range. The AFONT= and BFONT= options specify the
fonts for the actual value and the range boundary values, respectively.
The FORMAT= option specifies the SAS format for the values in the
chart.