GKPI Procedure

DIAL, HBULLET, HSLIDER, HTRAFFICLIGHT, SPEEDOMETER, VTRAFFICLIGHT, VBULLET, and VSLIDER Statement
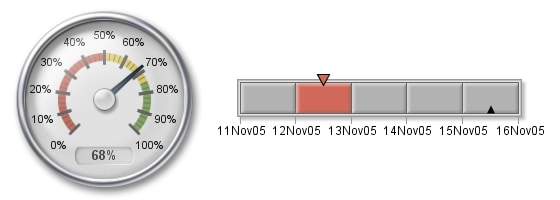
Creates a chart in one of seven display types.
| Requirement: | The ACTUAL= value and the BOUNDS= list are required. |
Syntax
<DIAL ACTUAL=value BOUNDS=bounds-list </ options>>;
<HBULLET | BULLET ACTUAL=value BOUNDS=bounds-list </ options;>>
<VBULLET ACTUAL=value BOUNDS=bounds-list </ options;>>
<HSLIDER | SLIDER ACTUAL=value BOUNDS=bounds-list </ options;>>
<VSLIDER ACTUAL=value BOUNDS=bounds-list </ options;>>
<HTRAFFICLIGHT ACTUAL=value BOUNDS=bounds-list </ options;>>
<VTRAFFICLIGHT | TRAFFICLIGHT ACTUAL=value
BOUNDS=bounds-list </ options;>>
BOUNDS=bounds-list </ options;>>
<SPEEDOMETER ACTUAL=value BOUNDS=bounds-list </ options>>;
Summary of Optional Arguments
Appearance options
specifies the list of active colors for each qualitative
range.
specifies the name, color, and text height for the
font used for the actual KPI value label.
specifies whether to display the actual KPI value
label.
specifies the name, color, and text height of the
font used for the boundary and tick mark values.
specifies whether to display the boundary values.
specifies the list of inactive colors for each qualitative
range.
specifies a SAS format for the boundary and actual
values.
specifies a label for the graphic.
specifies the name, color, and text height of the
font to use for the label that is specified by the LABEL= option.
specifies whether the KPI chart displays as if the
KPI value falls in the lower range or the upper range when the actual
KPI value falls directly on a range boundary.
specifies the numeric value of the target key performance
indicator.
specifies the size of the display for speedometers.
Drill-down option
adds a drill-down link to the KPI chart.
Output file description options
specifies the description of the output.
specifies the name of the graphics output file.
Required Arguments
- ACTUAL= data-value
-
specifies the actual value of the key performance indicator. The actual data value can fall outside the bounds specified with the BOUNDS= option, but the GKPI procedure will display the actual value indicator at the outermost edge of the KPI chart. If you specify a missing value (
ACTUAL=.), then the GKPI procedure does not generate a KPI chart.
Optional Arguments
You can specify as many options as needed and list them in any order.
- ACTIVECOLORS=(color–1 color–2 ...color–n)
- specifies the list of active colors for each qualitative range. This list is the colors that you want to use for each range when that range contains the actual KPI value. You do not have to specify a color for each range in the KPI chart. The default colors shown in GKPI Procedure Default Colors (or the colors specified by the COLORS= option) are used for each range for which active colors are not specified. The number of entries in the ACTIVECOLORS= list cannot exceed the number of ranges that are defined. That is, the maximum number of active colors is one less than the number of entries in the BOUNDS= list. Separate each color with either a blank space or a comma.
- AFONT=(<F=“fontname”</BOLD></ITALIC>> <C=color> <H=text-height<units>>)
- specifies the name, color, and text height for the
font used for the actual KPI value label. Style reference:Font attribute of the GraphLabelText elementSee:Font SuboptionsExample:
AFONT=(f="Comic Sans MS" c=red h=15pt)
Example:Creating a Dial KPI Chart
- BFONT=(<F=“fontname”</BOLD></ITALIC>> <C=color> <H=text-height<units>>)
- specifies the name, color, and text height of the
font used for the boundary and tick mark values. If you increase the
size of the font to the point where labels would collide, then the
intermediate labels are not displayed. The GKPI procedure displays
only the lowest and highest boundary labels.Style reference:Font attribute of the GraphValueText elementSee:Font SuboptionsExample:
BFONT=(font="Arial" color=H14055FF height=.25in)
Example:Creating a Dial KPI Chart
- BVALUE | NOBVALUE
- specifies whether to display the boundary values. Alias:BVAL | NOBVALDefault:BVALUE
- COLORS=(color–1 color–2 ...color–n)
- specifies the list of inactive colors for each qualitative
range. This list is the colors
that you want to be used for each range when that range does not contain
the actual KPI value. You must specify a color for each range in the
KPI chart. That is, the number of entries in the COLORS= list must
be one less than the number of entries in the BOUNDS= list. Separate
each color with either a blank space or a comma.For all KPI charts except traffic lights, if you define two to five ranges, the GKPI procedure applies a default set of colors ranging from red to green. If you define only one or more than five ranges, the default color for all ranges is gray.
- DESCRIPTION= “description”
- specifies the description of the output. The maximum length
for the description is 256 characters. The description does not appear
on the graph. The default is “Key performance indicator”.
-
the chart description for Web output. See Chart Descriptions for Web Presentations for more information.
Alias:DES=
- FORMAT=“SAS-format”
- specifies a SAS format for the boundary and actual
values. The default format
is BEST. For example, you can use
format="percent8.0"to display values as percentages orformat="datetime7."to display SAS datetime values in the formatddmmmyy.
- LABEL= “string”
- specifies a label for the graphic. The label is displayed
at the top of graph, beneath the title, if a title is specified.Note:By default, labels are displayed at the top center of the graphics output area, and the KPI chart is displayed in the center of the output area. To reduce the space between labels and the KPI chart, reduce the size of the graphics output area by specifying the XPIXELS=/YPIXELS= or HSIZE=/VSIZE= options in the GOPTIONS statement. See The Graphics Output and Device Display Areas for more information.Examples:Defining a Speedometer
- LFONT=(<F=“fontname”</BOLD></ITALIC>> <C=color> <H=text-height<units>> <J=LEFT | RIGHT | CENTER>)
- specifies the name, color, and text height of the
font to use for the label that is specified by the LABEL= option. You can also specify
whether the label is left-justified, centered, or right-justified
within the graphics output area. Style reference:Font attribute of the GraphLabelText elementExample:
LFONT=(f="Albany AMT/italic" c=cornflowerblue height=.25cm j=right)
Example:Defining a Speedometer
- LOWBOUNDARY | NOLOWBOUNDARY
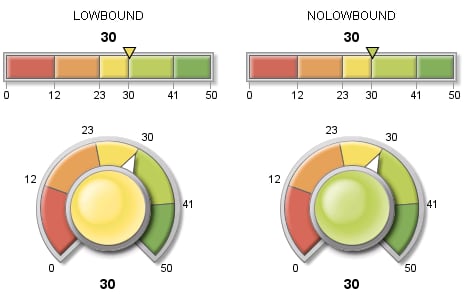
- specifies whether the KPI chart displays as if the KPI value falls in the lower range or the upper range when the actual KPI value falls directly on a range boundary. This option controls the color that is used for dial centers, traffic lights, and actual value indicators. It also controls which range is displayed in the active color, if an active color list is specified. The default is LOWBOUNDARY, which tells the GKPI procedure to use the color of the lower range. If you specify NOLOWBOUNDARY, then PROC GKPI uses the color of the higher range. LOWBOUND and NOLOWBOUND Effect on Indicator Colors illustrates the effect of this option on dial centers and on the actual KPI value indicator in a horizontal slider when both a range boundary and the actual KPI value is 30.
- NAME=“name”
- specifies the name of the graphics output file. The name can be up
to 256 characters long, and uppercase characters are converted to
lowercase. The default name is
graph.png. If the name duplicates an existing name, thenSAS/GRAPH graph1.png.
- TARGET= data-value
- specifies the numeric value of the target key performance
indicator. If you specify a missing
value (TARGET=.), then the GKPI procedure generates a KPI chart without
a target value indicator.Restriction:Not supported by the TRAFFICLIGHT statementExamples:Creating a Gray Scale Bullet Graph
Font Suboptions
You can control the
fonts that are used to display the boundary and tick mark values,
the actual KPI values, and the labels with BFONT=, AFONT=, and LFONT=
options, respectively. Each of these options takes a font specification
on the FONT= suboption.
<FONT=“fontname</BOLD></ITALIC>”> <COLOR=color>
<HEIGHT=text-height<units>> <JUSTIFICATION=LEFT | CENTER | RIGHT>
<HEIGHT=text-height<units>> <JUSTIFICATION=LEFT | CENTER | RIGHT>
- FONT= “fontname</BOLD></ITALIC>”
-
specifies the font name. You can specify only system fonts (such as TrueType and UNIX system fonts), not
SAS/GRAPH Alias:F=
- COLOR=color
-
specifies the text color. You can specify the color in any of the color-naming schemes recognized by
SAS/GRAPH Alias:C=