The HTSNP Procedure (Experimental)

Let ![]() represent the proportional frequencies of the
represent the proportional frequencies of the ![]() unique
unique ![]() -locus haplotypes in the input data set. The locus or allelic diversity
-locus haplotypes in the input data set. The locus or allelic diversity ![]() for the
for the ![]() individual loci and the overall haplotype diversity
individual loci and the overall haplotype diversity ![]() can be calculated as
can be calculated as
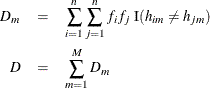
where ![]() is the allele of the
is the allele of the ![]() th haplotype observed at the
th haplotype observed at the ![]() th locus and the indicator function
th locus and the indicator function ![]() equals 1 when true and 0 otherwise (Clayton, 2002).
equals 1 when true and 0 otherwise (Clayton, 2002).
Based on a selected subset of ![]() SNPs, the
SNPs, the ![]() observed haplotypes can be partitioned into
observed haplotypes can be partitioned into ![]() distinct groups. Let
distinct groups. Let ![]() represent the set of haplotypes in group
represent the set of haplotypes in group ![]() , where each set contains all haplotypes that have identical alleles at the
, where each set contains all haplotypes that have identical alleles at the ![]() selected loci. The residual diversity is calculated by Clayton (2002) by summing the within-group diversity over the
selected loci. The residual diversity is calculated by Clayton (2002) by summing the within-group diversity over the ![]() groups, again both for the individual loci and over all haplotypes:
groups, again both for the individual loci and over all haplotypes:
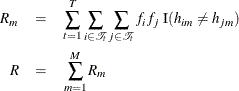
where ![]() . Note that
. Note that ![]() if locus
if locus ![]() is one of the
is one of the ![]() selected SNPs.
selected SNPs.
One of two criteria for finding the optimal set of htSNPs can be selected with the CRITERION= option. Using the diversity measures previously defined, the proportion of diversity explained (PDE) by a candidate SNP set can be calculated to evaluate the goodness of the set (Clayton, 2002):
The higher (that is, closer to 1) the value of PDE is, the better the set of htSNPs is for explaining the diversity among the haplotypes.
Alternatively, the approach of Stram et al. (2003) is implemented when CRITERION=RSQH. For these computations, define ![]() to be the actual number of copies of haplotype
to be the actual number of copies of haplotype ![]() that an individual with the
that an individual with the ![]() -locus haplotype pair
-locus haplotype pair ![]() (usually unknown) and genotype
(usually unknown) and genotype ![]() carries. Assuming Hardy-Weinberg equilibrium, this can be estimated as
carries. Assuming Hardy-Weinberg equilibrium, this can be estimated as
where ![]() is the set of haplotype pairs,
is the set of haplotype pairs, ![]() and its complement
and its complement ![]() , compatible with genotype
, compatible with genotype ![]() . Then
. Then ![]() can be defined as follows for each haplotype
can be defined as follows for each haplotype ![]() :
:
with ![]() representing each possible
representing each possible ![]() -locus genotype at the selected SNPs and
-locus genotype at the selected SNPs and ![]() . The set of
. The set of ![]() SNPs with the highest (that is, closest to 1) value of
SNPs with the highest (that is, closest to 1) value of ![]() is selected as the best set of htSNPs, for it optimizes the predictability of the common haplotypes (Stram et al., 2003).
is selected as the best set of htSNPs, for it optimizes the predictability of the common haplotypes (Stram et al., 2003).