Setting Indicator Properties
Specify the Height and Width of the Indicator
When setting the indicator
height and width, remember the following information:
-
The height and width settings apply only when the indicator is displayed by itself, not on a dashboard. These width and height properties are the default width and height. You can customize these values further when you add the indicator to a dashboard. When displayed on a dashboard, the indicator height and width are specified in the Object section of the dashboard Properties pane.
Change the Indicator Type
When you created the
indicator, you selected the indicator type. However, you can change
the selection at any time.
In the General Settings
section of the Properties pane, select the indicator type to use from
the Display list.
|
If you select KPI,
see Customize a KPI Indicator.
|
|
Specify the Graph Style
You can specify a graph
styling to apply to your selected indicator. Some selections are easier
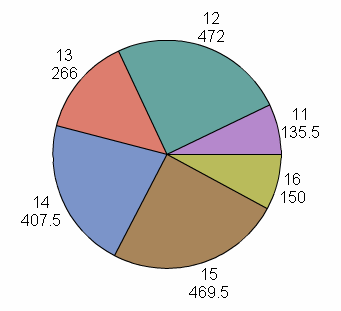
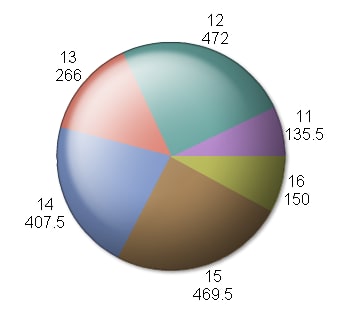
to read than others. For example, Simple and Crisp are
typically easier to read than Sheen. You
might want to view the different selections on the computer displays
that are used by your business users to make sure a graph style is
easy to read on the applicable displays.
Change the Indicator Data to Use
Change the Range to Use
Specify the Sort Order
You can sort the data
that is displayed in some indicator types. The Column Names in the
indicator data provide the selections to sort by.
Specify How to Display Data in the Indicator
The display settings
determine which data is included in the indicator, how the data is
grouped, how the data is summarized, and so on.
In the Display Settings
section of the Properties pane, select the display settings to use
for the indicator. The available settings vary depending on the selected
indicator. For
information about the display settings for each type of indicator,
see Indicator Dictionary.
Customize Indicator Alerts
Indicators provide the
alerting feature in the SAS BI Dashboard. This feature, which is available
in the Personalized User Settings section of the Properties pane,
is available only for indicators that support ranges. You can create
alerts in the following ways:
-
Create indicator alerts for a user or groups of users. See Working with Alerts for Another User or a Group of Users.
-
Enable a user to create personalized indicator alerts. See Enable Personalized Indicator Alerts.
Define Links in an Indicator
You can define links
in an indicator that opens other content. For more information,
see Adding Links to Indicators or Other Content.


