To start to create or edit an indicator
from within the SAS BI Dashboard portlet:
-
In a collection
portlet, click the item that starts the SAS BI Dashboard.
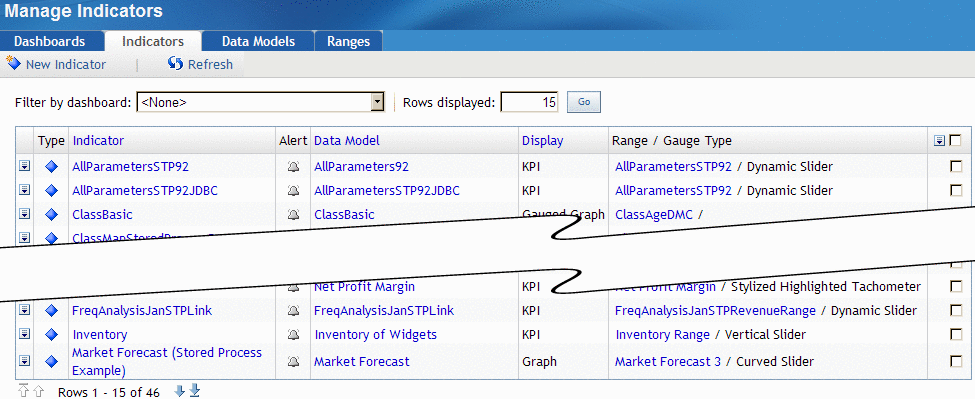
The Manage
Indicators page appears.
-
Do one
of the following:
-
To create an indicator, click
New Indicator on the Manage Indicators page.
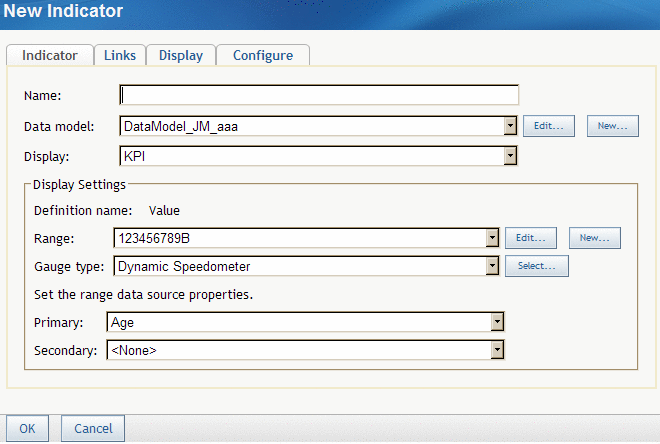
The New Indicator page
appears.
-
To edit an indicator, click the
name of the indicator.
The Indicator Properties
page appears.
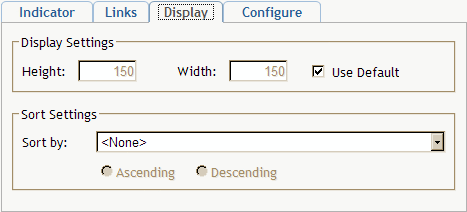
There
are four remaining steps to create or edit an indicator: