SAS® AppDev Studio™ 3.0 Developer's Site
| OLAPTableView: Interacting with the OLAPTableView |
|
|
Data Source: OLAP Information Map
This example includes the following customizations:
Please install the latest webAF template updates prior to building this example. For more information about the server-side example templates used by this example, see Web Application Example Templates and Built-in Web Application Templates and Options.
The following example is not meant to be a complete Web application, rather it is to show how to use a particular component(s). The example does not address the issue of immediately freeing up resources when the user navigates off the Web application or closes the Web browser. Any necessary resources created in the example will stay around until the associated HTTPSession times out. If this example is used in a multi-user environment, it is possible to exhaust the available resources until HTTPSessions time out and free up their associated resources.
The following assumptions are made for all SAS AppDev Studio examples that use an Information Map as a data source. Please refer to the SAS Intelligence Platform administration documentation for information about any of these topics.
- All of the necessary BI Platform components have already been installed properly on the local machine. This means, by default, that all of the servers and services used in the examples are pointing to the local machine on which ADS was installed.
- Servers are installed as services instead of being started manually.
Step 1: Create a project in webAF
- Create a new project named
OLAPTableView. - Select Web Application from the webAF Projects list.
- Accept the defaults as you go through the Web App wizard until you have reached step #4 of the wizard. At this step you will need to select Examples in the radio box titled Display list for. Choose the Information Map OLAPTableView Servlet item from the "Type of initial content" list box.
- Continue accepting defaults as you complete the Web App wizard.
Step 2: Set up access to the data source
- Specify the Information Map by double-clicking the
InfoMapOLAPTableViewExampleControllerServlet.javafile in the Files Tab of the Project Navigator. ReplaceENTER_MAP_NAME_HEREin the following code:String mapName = ENTER_MAP_NAME_HERE;
with URL string for your information map. - Insert the correct metadata password (
omr_password) in thesas_metadata_source_omr.propertiesfile located in theweb-inf\confdirectory. This password is used when deploying Foundation Services. - Insert the correct metadata password (
metadata-password) under the InfoMapOLAPTableViewExampleControllerServlet's initial parameters in theweb.xmlfile located in theweb-infdirectory. This password is used to get a user and session context from the Foundation Services.
Step 3: Add components to the JSP file
The following actions can be performed after executing the project. Skip ahead to the Finish the project section, and then refer back to these instructions.
Customization: Expand
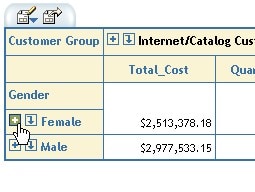
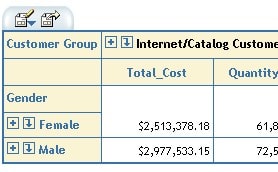
Expand displays the next level of data within the current table. You can expand any item that has a plus sign next to it. For example, if you want to expand Female in the table below, click on the plus sign next to Female.
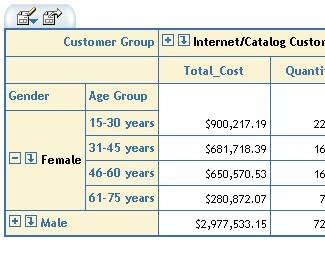
The table expands to show the results below. Now you see age groups for the Female gender. You can continue to expand the data until the plus signs are no longer available.
Customization: Collapse
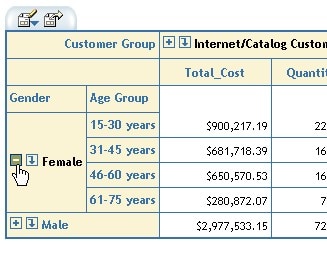
Collapse is the opposite of expand. You can collapse any level that has been expanded by clicking the minus sign next to it. For example, to collapse Female in the table below, click on the minus sign next to Female.
The table collapses back down to show the results below.
Customization: Drilldown
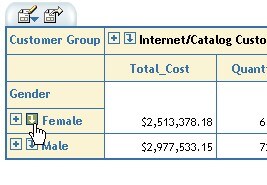
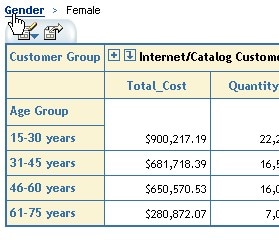
Drilldown displays the next level of data in a new table. You can drill down on any item that has a down arrow next to it. For example, in the table below, click on the down arrow next to Female.
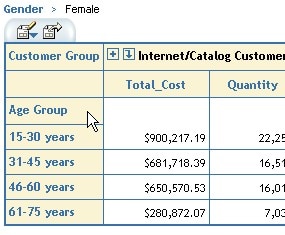
Now you see the following table. It shows the next level, Age Group, for all Female data. Notice the text above the table documents the drilldown. You can continue to drill down in the data until the down arrows are no longer available. In our example, there is no arrow next to any of the age groups, which means we have drilled down to the lowest level of the hierarchy.
Customization: Up to <Level>
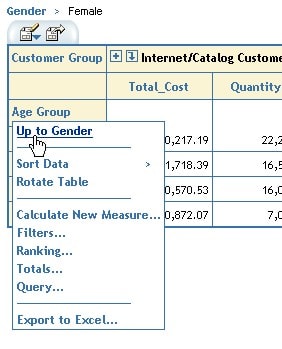
Up to reverses a drilldown. You can go back up to any level that you have drilled down on by selecting Up to <level> from the menu. For example, to go back up to Gender, click on Age Group and select Up to Gender from the pop-up menu.
Now you see the following table, showing Gender again instead of Age Group. Notice the text above the table disappeared to show the drilldown is no longer in effect.
Customization: Breadcrumb
The breadcrumb is the text above a table that shows the current drill state. Using the breadcrumb is another way to go up to a level. You can go back up to any level that has been drilled on by selecting the link for that level in the breadcrumb. For example, to go back up to Gender after a drilldown on that level, select the Gender link in the breadcrumb.
You see the same results as performing an Up on Gender.
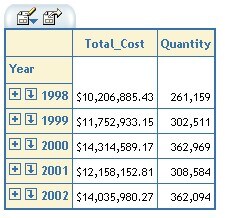
If you drill down more than once, you may use the breadcrumb to go to any of the previous drill states. For example, see the table below.
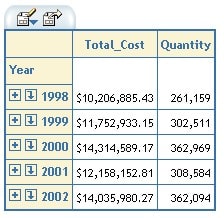
If you drill down on 1998 and again on Jan, you see the following table.
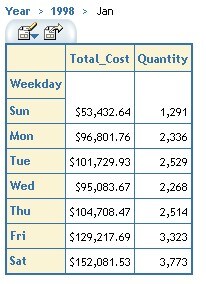
In the breadcrumb above the table, you can click on 1998 to take you back to the data for 1998.
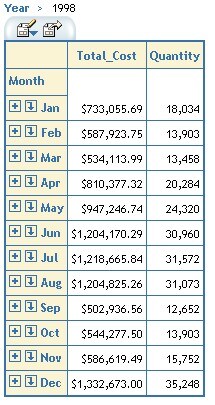
Or you can click on Year in the breadcrumb to take you all the way back to the "top", with no drills present.
Customization: Sort
Sorting allows you to change the order of the data shown in the report.
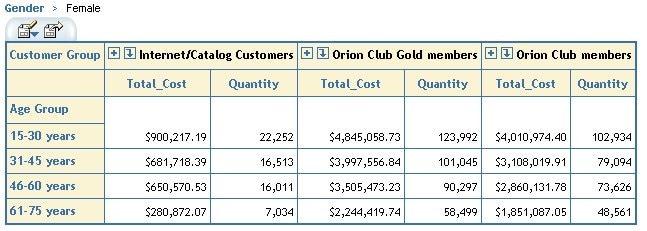
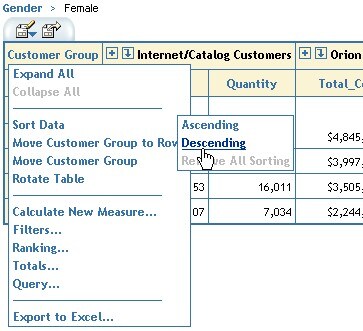
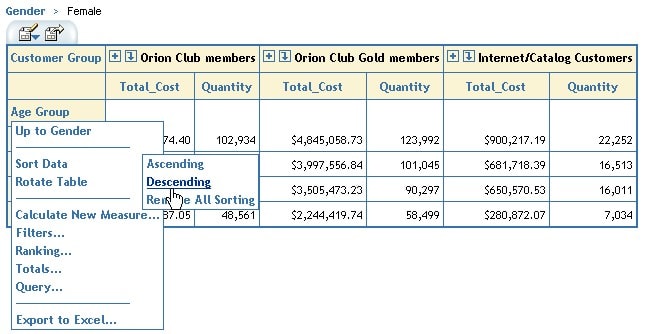
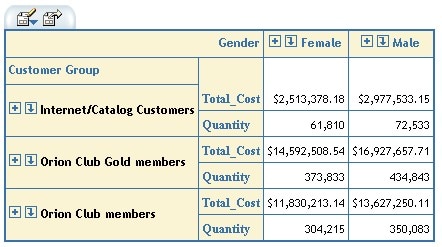
To sort a level, click on that level, select Sort Data, and select Ascending, Descending, or Remove All Sorting. For example, see the table above. To sort the column labels for the Customer Group level descending, click on Customer Group, select Sort Data, and then select Descending.
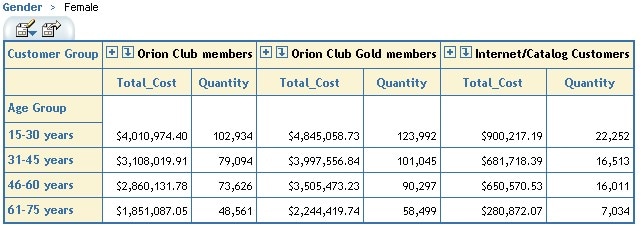
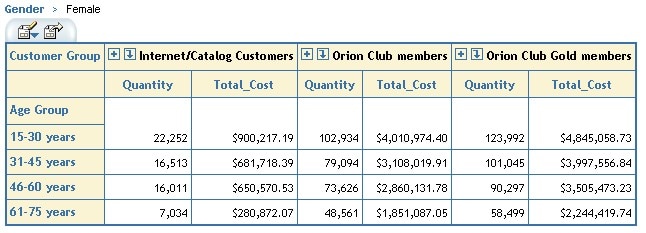
Now you see that the column labels for Customer Group have been sorted in descending order.
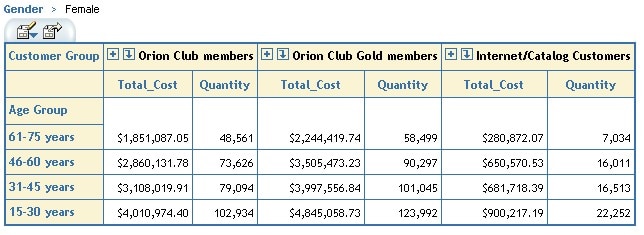
You can also sort the row labels. For example, the labels for Age Group are sorted in ascending order below. To sort Age Group labels descending, click on Age Group, select Sort Data, and then select Descending.
Now the row labels for Age Group are sorted in descending order. Notice that the descending sort for the Customer Group column labels is still in effect. As long as the current sort does not conflict with the previous sort, the previous sort remains in effect.
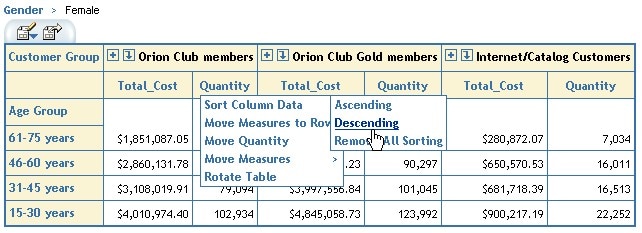
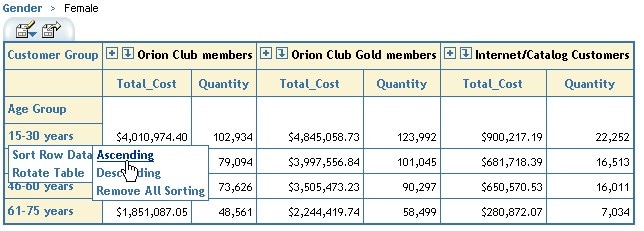
Not only can you sort the labels for a level, you can also sort the data for a column or a row. To sort the data for a column, click on the measure for that column, select Sort Column Data, and select Ascending, Descending, or Remove All Sorting. From our example above, click on Quantity for Orion Club Members, select Sort Column Data, and click on Descending.
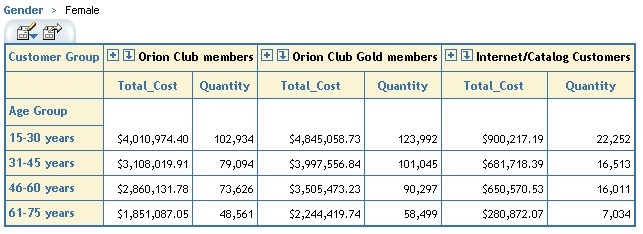
Now the Quantity column for Orion Club members has been sorted in descending order. Notice that the descending sort for Age Group is no longer in effect, because it is negated by the column sort you just performed. However, the descending sort for Customer Group is still in effect, because sorting the column data does not interfere with the column label sort.
To sort the data for a row, click on the label for that row, select Sort Row Data, and select Ascending, Descending, or Remove All Sorting. To continue with our example, click on 15-30 years, select Sort Row Data, and click on Ascending.
Now the row for the 15-30 years Age Group is sorted ascending. Notice that this did not negate the column data sort that you just performed, but it did negate the column label sort for Customer Group.
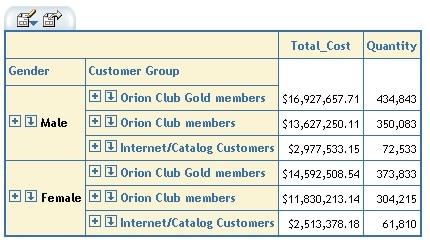
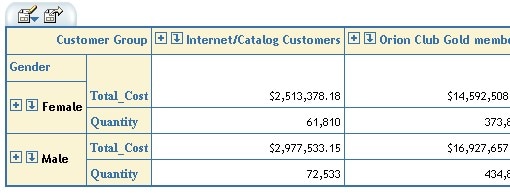
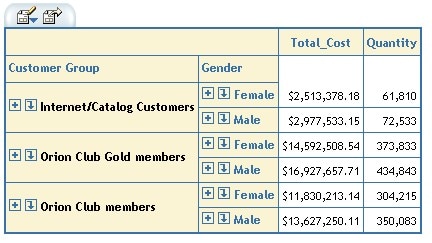
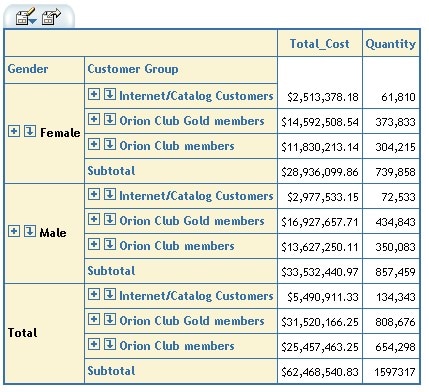
When you have more than one level on the rows or columns, sorting is a little more complex. For example, see the following table.
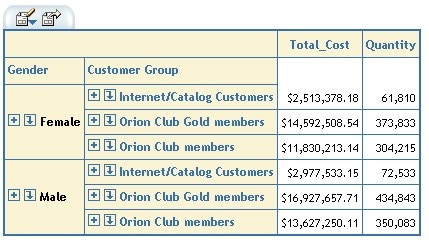
To sort the first column of data descending, click on Total_Cost, select Sort Column Data, and click Descending.
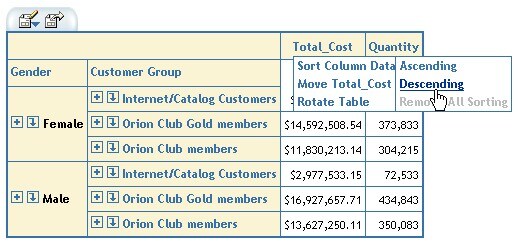
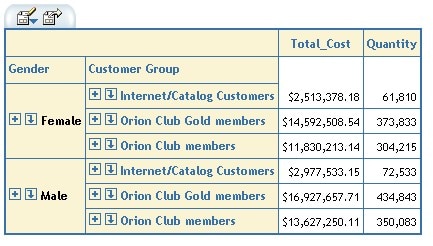
You will see that the inner level, Customer Group, is sorted descending for each Gender shown. Also, Gender is sorted descending.
Customization: Move
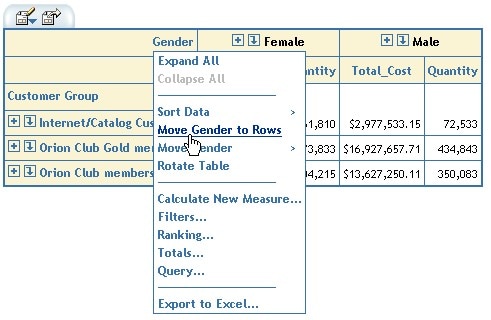
The move operation moves a level from one axis to the other. To move a level from one axis another, click on the level label and select Move <level> to Rows or Move <level> to Columns. For example, to move Gender from columns to rows, click on Gender and select Move Gender to Rows.
Now you see Gender on the rows as well as Customer Group (which was already on the rows). You can move any level other than a measure or statistic to the rows or columns as long as there are at least two levels or a measure on that axis. There must be a level or measure left on the axis after the move. For example, in the previous figure, you could move Gender to the rows because there will be a measure left on the columns. However, you could not move Customer Group to the columns because there is no other level left on the rows. Once you move Gender to the rows as in the following table, you can then move Customer Group to the columns because Gender will be left on the rows.
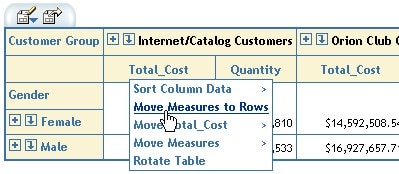
You can also move measures to the rows or to the columns, as long as there is another level on the axis you want to move the measures from. To move the measures, click on a measure label and select Move Measures to Rows or Move Measures to Columns. For example, in the table below, click on Total_Cost and select Move Measures to Rows.
Now you see the following table, with the measures, Total_Cost and Quantity, on the rows.
Customization: Shift
Shift is similar to move, but it moves a level within the axis instead of to a different axis. You can shift measures left/right or up/down. For levels other than measures on the row axis, you can shift them left or right. For levels other than measures on the column axis, you can shift them up or down. To shift a level, click on the level, choose Move <level>, and select Left, Right, Up, or Down. For example, in the following table, to move the Total_Cost measure right, click on Total_Cost, select Move Total_Cost, and click on Right.
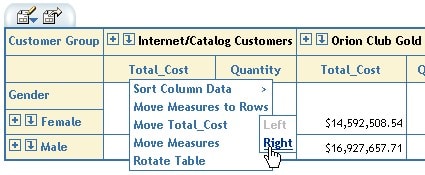
Now you see the following table with Total_Cost shifted to the right. Now Quantity is shown before Total_Cost in the table.
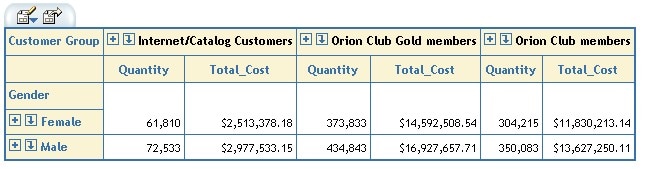
If you have two levels on the row axis, you can shift them. For example, in the following table, to shift Customer Group to the left, click on Customer Group, select Move Customer Group, and click Left.
Now you see the following table with Customer Group shifted to the left. Now Customer Group is shown before Gender in the table.
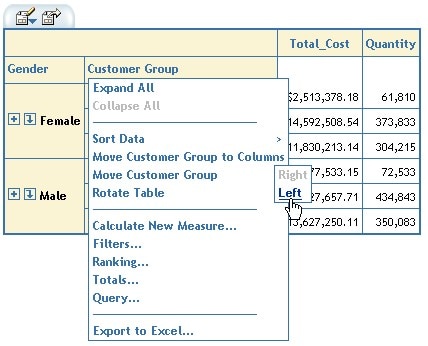
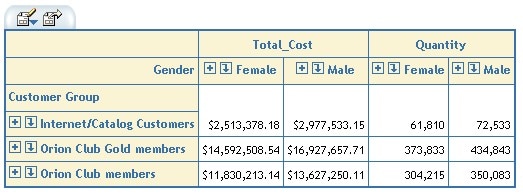
You can shift the measures in a table to be before or after the other levels on that axis. For example, in the table below, to move the measures up, click on one of the measures (we'll use Total_Cost), select Move Measures, and click on Up.
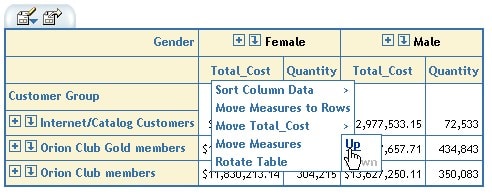
Now you see the following table with the measures shown above the other level, Gender.
Customization: Rotate
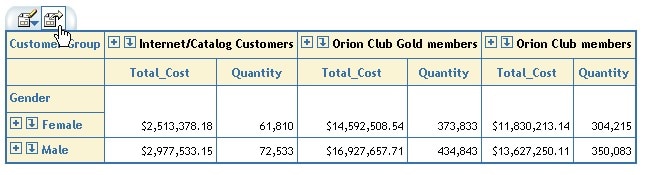
Rotate simply switches the axes of the table. The content of the rows goes to the columns, and the content of the columns goes to the rows. To rotate a table, click on any link in the table, level or member, and select Rotate Table. For example, to rotate the table below, click on Total_Cost and select Rotate Table.
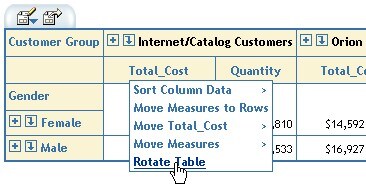
Now you see that Gender has moved to the column axis and Customer Group and the measures have moved to the row axis.
Customization: Query
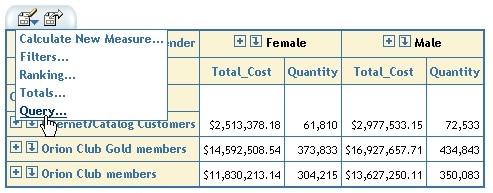
The Query dialog allows you to change the query for a table. You can add and remove items from the rows and columns, or you can move them between rows and columns. To get to the Query dialog, click on the Edit Options icon at the top left corner of the table, and select Query... from the menu.
The Query dialog comes up. You will see an available items list and a selected items list. There is an Assign To box that will let you choose between assigning items to rows or columns. There is also a View Items box that will let you view the items by item type or alphabetically. You can use the left and right arrows to add an item to or remove an item from the selected axis. The up and down arrows in the lower right corner allow you to move your selection up or down within the selected axis. The Move Item button will move the selected level from the current axis to the other axis.
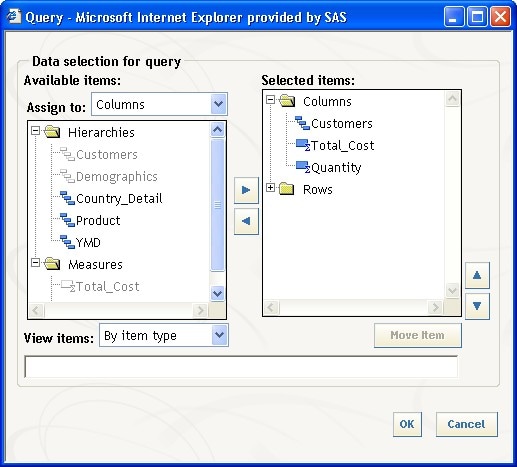
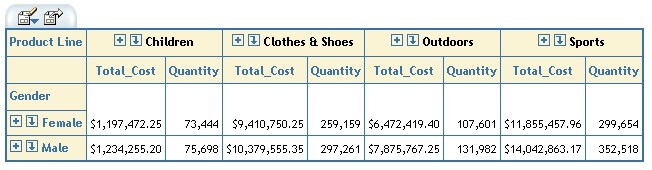
For example, change the level on the column axis from Customers to Product. Select Columns in the Assign To box. Click Customers in the Selected Items box and click the left arrow to move it to the Available Items box. Then click Customers in the Available Items box and click the right arrow to move it to the Selected Items box.
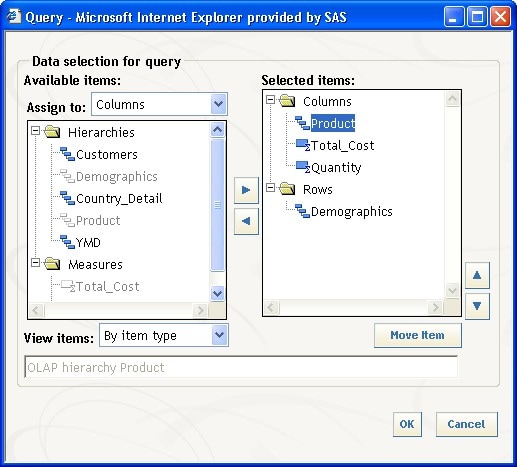
Now click OK. The Query dialog closes and the table is updated with the new query. Now you see Product Line on the columns instead of Customer Group.
Customization: Totals
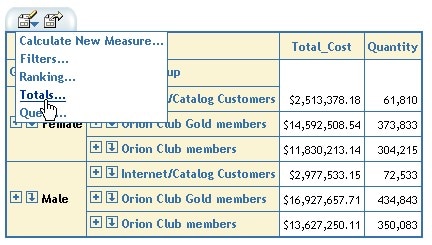
The Totals dialog allows you to turn on/off totals and subtotals for rows and columns. To get to the Totals dialog, click the Edit Options icon at the top left corner of the table, and select Totals from the menu.
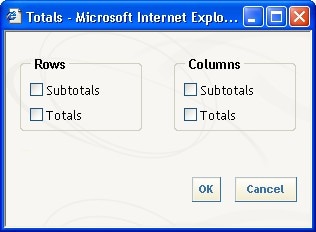
The following dialog comes up, and you can select (or unselect) totals and/or subtotals for columns and rows.
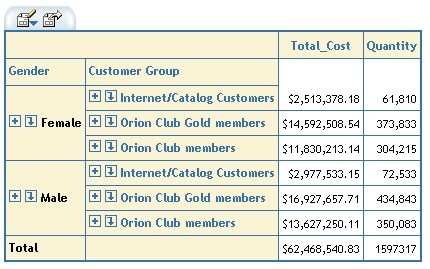
For example, click the box for totals under Rows. Click OK. The dialog closes and you see the following table, showing a total for the rows.
You can also show subtotals for rows or columns if you have more than one level on the axis. For example, go back into the Totals dialog and select subtotals for Rows. Click OK and you will see the following table, showing a subtotal for each Gender as well as a total for all rows.
Customization: Export
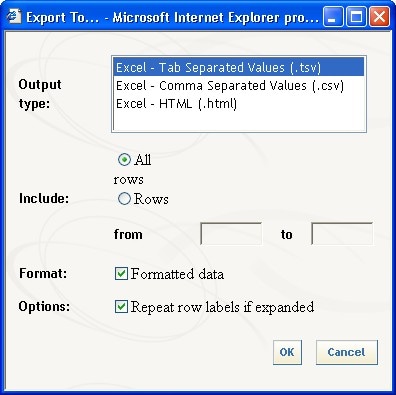
Export allows you to download the current table view to an Excel format. To bring up the Export dialog, click the Export To button at the top left corner of the table, shown in the figure below.
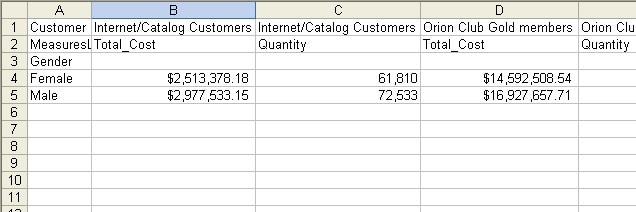
The Export dialog allows you to choose the output type: tsv, csv, or html. You may also choose to export all rows or only specific rows, and you may select formatted data, and whether to repeat expanded row labels.
When you make your selections in the dialog and click OK, you see a table similar to the following. You can open this table or save it for future reference.