| Exploring Data in Three Dimensions |
Rotating Plot Properties
This section describes the property tabs associated with a rotating plot. To access the rotating plot properties, right-click near the center of a plot, and select Plot Area Properties from the pop-up menu.
Tabs not discussed in this chapter are discussed in Chapter 9, "General Plot Properties."
The Surface Tab
The Surface tab (Figure 7.4) controls attributes of the rotating plot. You can use the Surface tab to control the placement of axes, the type of surface that is drawn, and whether contours of the data are shown in the (X,Y) plane.- Axis Locations
-
specifies the location of axes.
- At midpoint
- specifies that the origin of each axis is placed at the midpoint of the range of the variable for that axis.
- At minima
- specifies that the origin of each axis is placed at the minimum value of the variable for that axis.
- 3 sections
- specifies that each axis is placed on an edge of the bounding cube surrounding the data so that the axis interferes as little as possible with viewing the data.
- Off
- specifies that no axes are displayed.
- Surface Drawing Modes
-
specifies the attributes of the surface added to the rotating plot.
- Transparent mesh
- specifies that the surface is drawn as a wire mesh, but hidden-line removal is not performed.
- Opaque mesh
- specifies that the surface is drawn as a wire mesh and hidden-line removal is performed.
- Block color mesh
- specifies that the surface is drawn as a patch of rectangles in which each rectangle is a single color.
- Smooth color mesh
- specifies that the surface is drawn as a patch of triangles in which each triangle is a single color.
- Stacked contours
- specifies that the surface is not drawn, but that contour levels are drawn.
- Stacked contours mesh
- specifies that the surface is drawn as for Opaque mesh and also that contour levels are added as for Stacked contours.
- Off
- specifies that no surface is displayed.
- Contour Projections
-
specifies whether contours of the data are shown in the (X,Y)
plane.
- Show contour lines
- specifies that contours for the surface are shown projected onto the (X,Y) plane.
- Show contour areas
- specifies that region between projected contours are filled with color.
- Show contour values
- specifies whether projected contour lines are labeled by the value of the Z axis variable.
The Contours Tab
The Contours tab controls attributes of the projected contours for the surface. The Contours tab is described in the section "Contour Plot Properties".The Grid Tab
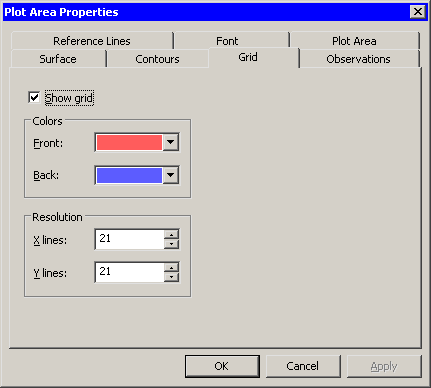
The Grid tab (Figure 7.12) controls the size and color of the grid used to construct a surface and to compute contours for the surface.- Show grid
- specifies whether to display a grid on the displayed surface.
- Colors
- specifies the color of the grid when seen from the front (positive Z direction) or back (negative Z direction).
- Resolution
- specifies the resolution of the computational grid used to fit a surface to the data. The algorithm that computes the surface uses a grid superimposed on the (X,Y) plane. This grid consists of evenly spaced subdivisions along the X and Y axes. Generally, having more subdivisions results in a smoother surface, whereas having fewer subdivisions results in a rougher surface.
|
Figure 7.12: The Grid Tab
The Observations Tab
The Observations tab (Figure 7.5) controls the attributes of markers in the rotating plot.The Observations tab for the rotating plot contains all the controls documented in the section "Scatter Plot Properties". In addition, the Observations tab for the rotating plot includes the following check boxes:
- Show rays
- specifies whether lines are drawn from the center of the bounding cube to each observation marker.
- Show depth perception
- specifies whether observation markers are drawn in varying sizes to indicate their distance from the viewer.
The Reference Lines Tab
The Reference Lines tab (Figure 7.6) controls the attributes of reference lines in the rotating plot.The Reference Lines tab for the rotating plot contains all the controls documented in the section "The Reference Lines Tab". In addition, the Reference Lines tab for the rotating plot includes the following check box:
- Show Z reference lines
- specifies whether to show reference lines for the Z axis.
The Plot Area Tab
The Plot Area tab (Figure 7.7) controls the attributes of plot area in the rotating plot.- Background
- specifies the color of the background of the plot area.
- Show plot frame box
- specifies whether to display a framing box surrounding the plot area.
Copyright © 2008 by SAS Institute Inc., Cary, NC, USA. All rights reserved.