| Exploring Data in Two Dimensions |
Scatter Plot Properties
This section describes the Observations tab associated with a scatter plot. To access the scatter plot properties, right-click near the center of a plot, and select Plot Area Properties from the pop-up menu.
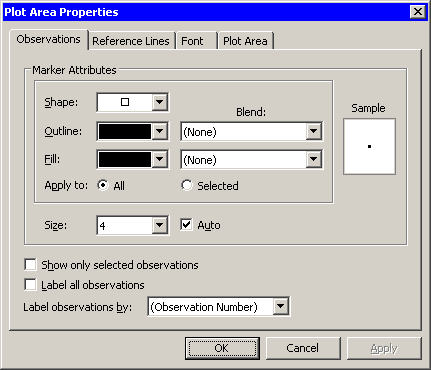
The Observations tab controls attributes of the scatter plot. The Observations tab is shown in Figure 6.9.
- Marker Attributes: Shape
- sets the shape of the marker for each observation.
- Marker Attributes: Outline
- specifies the color of the marker boundary. If the Blend list is set to None, the Outline list enables you to specify the outline color of observation markers. If the Blend list is not set to None, the Outline list enables you to specify the color blend to be used to color the outlines of observation markers.
- Marker Attributes: Blend (Outline)
- sets the variable whose values should be used to perform color blending for the outline colors of observation markers. If this value is set to None, color blending is not performed.
- Marker Attributes: Fill
- specifies the color of the marker interior. If the Blend list is set to None, the Fill list enables you to specify the fill color of observation markers. If the Blend list is not set to None, the Fill list enables you to specify the color blend to be used to color the interiors of observation markers.
- Marker Attributes: Blend (Fill)
- sets the variable whose values should be used to perform color blending for the fill colors of observation markers. If this value is set to None, color blending is not performed.
- Marker Attributes: Apply to
- specifies whether marker shape and color changes should be applied to all observations, or just the ones currently selected.
- Marker Attributes: Size
- specifies the size of observation markers. All observation markers in a plot are drawn at the same size. Selecting Auto causes the size of markers to change according to the size of the plot.
- Show only selected observations
- specifies whether observation markers are shown only for selected observations.
- Label all observations
- specifies whether labels are displayed next to each observation marker.
- Label observations by
- specifies the variable to use to label observations.
|
Figure 6.9: Plot Area Properties for a Scatter Plot
For a discussion of the remaining tabs, see Chapter 9, "General Plot Properties."
Copyright © 2008 by SAS Institute Inc., Cary, NC, USA. All rights reserved.