| The Data Table |
Observation Properties
This section describes how to change properties of observations. You can do the following:
- select observations
- change the shapes and colors of markers associated with observations
- change whether certain observations are included or excluded from plots and from analyses
The row heading to the left of the data table gives the status of each observation. The heading indicates whether an observation is selected, which shape and color is used to represent the observation in plot, and whether the observation is included in analyses.
You can change the properties of selected observations by using the
Observations menu.
You can access the Observations menu by selecting
Edit ![]() Observations from the main menu.
Alternatively, right-clicking on the row heading of a selected
observation displays
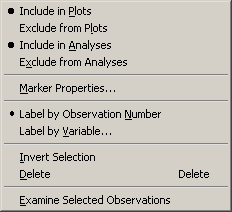
the same Observations menu, shown in Figure 4.5.
Observations from the main menu.
Alternatively, right-clicking on the row heading of a selected
observation displays
the same Observations menu, shown in Figure 4.5.

|
Figure 4.5: The Observations Menu
The following list describes each item on the observation menu.
- Include in Plots
- includes the selected observations in graphs.
- Exclude from Plots
- excludes the selected observations from graphs.
- Include in Analyses
- includes the selected observations in statistical analyses.
- Exclude from Analyses
- excludes the selected observations from statistical analyses.
- Marker Properties
- displays the Marker Properties dialog box, shown in Figure 4.8.
- Label by Observation Number
- sets the label that is displayed in the left-most column of the data table to be the observation number. The observation number is also set as the default label that is displayed when you click on an observation marker in a graph.
- Label by Variable
- displays the Label by Variable dialog box, shown in Figure 4.9.
- Invert Selection
- changes the set of selected observations. Unselected observations become selected, while selected observations become unselected.
- Delete
- deletes the selected observations.
- Examine Selected Observations
- displays the Examine Selected Observations dialog box, shown in Figure 4.14. You can use this dialog box to view and compare the selected observations.
Selecting Observations
Changing Marker Properties
Changing Observation Labels
Including and Excluding Observations
Copyright © 2008 by SAS Institute Inc., Cary, NC, USA. All rights reserved.