| The Data Table |
Selecting Observations
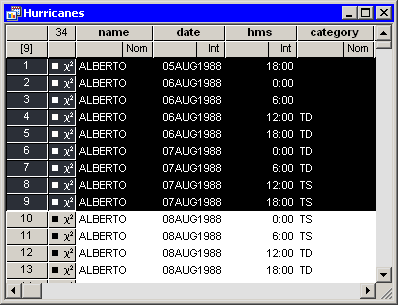
You can select observations in a data table by clicking on the row heading to the left of the data table. You can drag to select contiguous observations. You can click while holding down the CTRL key to select new observations without losing the ones already selected. Figure 4.6 shows selected observations.
Note: To select observations, you must click or drag in the row
headings on the left side of the data table. Highlighting a range of
cells in the data table does not select the
observations. The section "Adding and Editing Observations"
lists operations that you can perform on a
range of cells.
|
Figure 4.6: Selected Observations
Clicking in any of the four cells in the upper-left corner of the data
table does the following:
- Right-clicking in a cell brings up the Observations menu shown in Figure 4.5. Consequently, this is a safe place to right-click when you want to change properties of the selected observations, but no selected observations are currently visible.
- Click in the upper-left or lower-right cell to deselect all observations and variables.
- Click in the upper-right cell to deselect all observations and select all variables.
- Click in the lower-left cell to deselect all variables and select all observations.
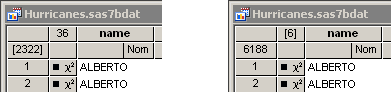
If no observations are selected, the lower-left cell displays the total number of observations in the data table. If observations are selected, the lower-left cell displays (in brackets) the number of selected observations.
If no variables are selected, the upper-right cell displays the total number of variables in the data table. If variables are selected, the upper-right cell displays (in brackets) the number of selected variables.
Figure 4.7 illustrates two possibilities. The left portion of
the figure indicates a data table that has 2,322 selected
observations; none of the 36 variables are selected. The right
portion of the figure indicates that 6 variables are selected, but
none of the 6,188 observations are selected.
|
Figure 4.7: Indicating Selected Observations (left) and Variables (right)
Copyright © 2008 by SAS Institute Inc., Cary, NC, USA. All rights reserved.