| The Data Table |
Including and Excluding Observations
You can choose which observations appear in plots and which are used in analyses.
To include or exclude observations, first select the observations.
From the Edit ![]() Observations menu, you can then select
Include in Plots, Exclude from Plots, Include in Analyses,
or Exclude from Analyses.
Observations menu, you can then select
Include in Plots, Exclude from Plots, Include in Analyses,
or Exclude from Analyses.
The row heading of the data
table shows the status of an observation in analyses and plots. A
marker symbol indicates that the observation is included in plots;
observations excluded from plots do not have a marker symbol shown in
the data table. Similarly, the ![]() symbol is present if and only
if the observation is included in analyses. If an observation is
excluded from analyses but included in plots, then the marker symbol
changes to the
symbol is present if and only
if the observation is included in analyses. If an observation is
excluded from analyses but included in plots, then the marker symbol
changes to the ![]() symbol.
symbol.
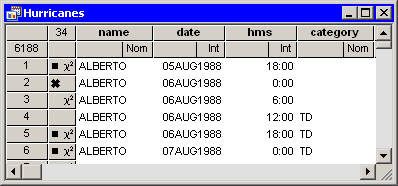
For example, Figure 4.10 shows what the data table would
look like if you excluded some observations. In this example, the
second observation was included in plots but excluded from
analyses. The third observation was excluded from plots but included
in analyses. The fourth observation was excluded from both plots and
analyses.
|
Figure 4.10: Excluded Observations
Copyright © 2008 by SAS Institute Inc., Cary, NC, USA. All rights reserved.