The CLUSTER Procedure

Example 33.1 Cluster Analysis of Flying Mileages between 10 American Cities
This example clusters 10 American cities based on the flying mileages between them. Six clustering methods are shown with corresponding dendrograms. The EML method cannot be used because it requires coordinate data. The other omitted methods produce the same clusters, although not the same distances between clusters, as one of the illustrated methods: complete linkage and the flexible-beta method yield the same clusters as Ward’s method, McQuitty’s similarity analysis produces the same clusters as average linkage, and the median method corresponds to the centroid method.
All of the methods suggest a division of the cities into two clusters along the east-west dimension. There is disagreement, however, about which cluster Denver should belong to. Some of the methods indicate a possible third cluster that contains Denver and Houston.
The following step displays the city mileage SAS data set, which is available in the Sashelp library and is designated as a TYPE=DISTANCE data set when it is used by PROC CLUSTER:
proc print noobs data=sashelp.mileages;
run;
Output 33.1.1: City Mileage Data Set
| Atlanta | Chicago | Denver | Houston | LosAngeles | Miami | NewYork | SanFrancisco | Seattle | WashingtonDC | City |
|---|---|---|---|---|---|---|---|---|---|---|
| 0 | . | . | . | . | . | . | . | . | . | Atlanta |
| 587 | 0 | . | . | . | . | . | . | . | . | Chicago |
| 1212 | 920 | 0 | . | . | . | . | . | . | . | Denver |
| 701 | 940 | 879 | 0 | . | . | . | . | . | . | Houston |
| 1936 | 1745 | 831 | 1374 | 0 | . | . | . | . | . | Los Angeles |
| 604 | 1188 | 1726 | 968 | 2339 | 0 | . | . | . | . | Miami |
| 748 | 713 | 1631 | 1420 | 2451 | 1092 | 0 | . | . | . | New York |
| 2139 | 1858 | 949 | 1645 | 347 | 2594 | 2571 | 0 | . | . | San Francisco |
| 2182 | 1737 | 1021 | 1891 | 959 | 2734 | 2408 | 678 | 0 | . | Seattle |
| 543 | 597 | 1494 | 1220 | 2300 | 923 | 205 | 2442 | 2329 | 0 | Washington D.C. |
A partial listing from the following statements include Output 33.1.2 and Output 33.1.3:
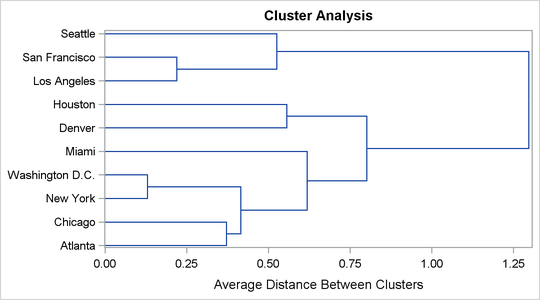
title 'Cluster Analysis of Flying Mileages Between 10 American Cities';
ods graphics on;

title2 'Using METHOD=AVERAGE';
proc cluster data=sashelp.mileages(type=distance) method=average pseudo;
   id City;
run;
Output 33.1.2: Cluster History Using METHOD=AVERAGE
| Cluster Analysis of Flying Mileages Between 10 American Cities |
| Using METHOD=AVERAGE |
| Cluster History | |||||||
|---|---|---|---|---|---|---|---|
| Number of Clusters |
Clusters Joined | Freq | Pseudo F Statistic |
Pseudo t-Squared |
Norm RMS Distance |
Tie | |
| 9 | New York | Washington D.C. | 2 | 66.7 | . | 0.1297 | |
| 8 | Los Angeles | San Francisco | 2 | 39.2 | . | 0.2196 | |
| 7 | Atlanta | Chicago | 2 | 21.7 | . | 0.3715 | |
| 6 | CL7 | CL9 | 4 | 14.5 | 3.4 | 0.4149 | |
| 5 | CL8 | Seattle | 3 | 12.4 | 7.3 | 0.5255 | |
| 4 | Denver | Houston | 2 | 13.9 | . | 0.5562 | |
| 3 | CL6 | Miami | 5 | 15.5 | 3.8 | 0.6185 | |
| 2 | CL3 | CL4 | 7 | 16.0 | 5.3 | 0.8005 | |
| 1 | CL2 | CL5 | 10 | . | 16.0 | 1.2967 | |
Output 33.1.3: Dendrogram Using METHOD=AVERAGE
A partial listing from the following statements include Output 33.1.4 and Output 33.1.5:
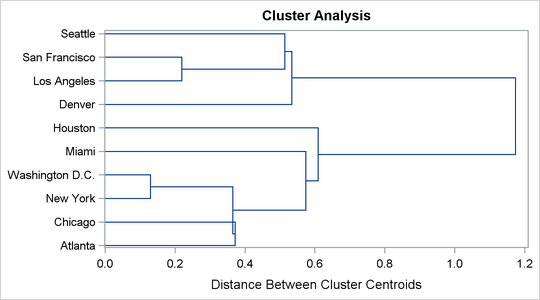
title2 'Using METHOD=CENTROID';
proc cluster data=sashelp.mileages(type=distance) method=centroid pseudo;
   id City;
run;
Output 33.1.4: Cluster History Using METHOD=CENTROID
| Cluster Analysis of Flying Mileages Between 10 American Cities |
| Using METHOD=CENTROID |
| Cluster History | |||||||
|---|---|---|---|---|---|---|---|
| Number of Clusters |
Clusters Joined | Freq | Pseudo F Statistic |
Pseudo t-Squared |
Norm Centroid Distance |
Tie | |
| 9 | New York | Washington D.C. | 2 | 66.7 | . | 0.1297 | |
| 8 | Los Angeles | San Francisco | 2 | 39.2 | . | 0.2196 | |
| 7 | Atlanta | Chicago | 2 | 21.7 | . | 0.3715 | |
| 6 | CL7 | CL9 | 4 | 14.5 | 3.4 | 0.3652 | |
| 5 | CL8 | Seattle | 3 | 12.4 | 7.3 | 0.5139 | |
| 4 | Denver | CL5 | 4 | 12.4 | 2.1 | 0.5337 | |
| 3 | CL6 | Miami | 5 | 14.2 | 3.8 | 0.5743 | |
| 2 | CL3 | Houston | 6 | 22.1 | 2.6 | 0.6091 | |
| 1 | CL2 | CL4 | 10 | . | 22.1 | 1.173 | |
Output 33.1.5: Dendrogram Using METHOD=CENTROID
A partial listing from the following statements include Output 33.1.6 and Output 33.1.7:
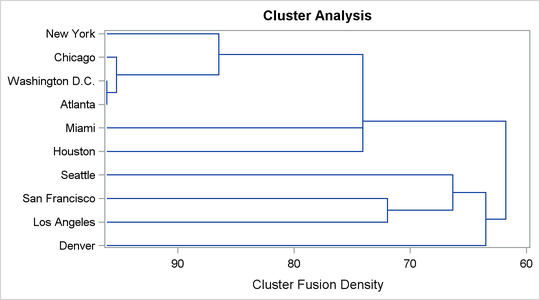
title2 'Using METHOD=DENSITY K=3';
proc cluster data=sashelp.mileages(type=distance) method=density k=3;
   id City;
run;
Output 33.1.6: Cluster History Using METHOD=DENSITY K=3
| Cluster Analysis of Flying Mileages Between 10 American Cities |
| Using METHOD=DENSITY K=3 |
| Cluster History | ||||||||
|---|---|---|---|---|---|---|---|---|
| Number of Clusters |
Freq | Normalized Fusion Density |
Maximum Density in Each Cluster |
Tie | ||||
| Clusters Joined | Lesser | Greater | ||||||
| 9 | Atlanta | Washington D.C. | 2 | 96.106 | 92.5043 | 100.0 | ||
| 8 | CL9 | Chicago | 3 | 95.263 | 90.9548 | 100.0 | ||
| 7 | CL8 | New York | 4 | 86.465 | 76.1571 | 100.0 | ||
| 6 | CL7 | Miami | 5 | 74.079 | 58.8299 | 100.0 | T | |
| 5 | CL6 | Houston | 6 | 74.079 | 61.7747 | 100.0 | ||
| 4 | Los Angeles | San Francisco | 2 | 71.968 | 65.3430 | 80.0885 | ||
| 3 | CL4 | Seattle | 3 | 66.341 | 56.6215 | 80.0885 | ||
| 2 | CL3 | Denver | 4 | 63.509 | 61.7747 | 80.0885 | ||
| 1 | CL5 | CL2 | 10 | 61.775 | * | 80.0885 | 100.0 | |
Output 33.1.7: Dendrogram Using METHOD=DENSITY K=3
A partial listing from the following statements include Output 33.1.8 and Output 33.1.9:
title2 'Using METHOD=SINGLE';
proc cluster data=sashelp.mileages(type=distance) method=single;
   id City;
run;
Output 33.1.8: Cluster History Using METHOD=SINGLE
| Cluster Analysis of Flying Mileages Between 10 American Cities |
| Using METHOD=SINGLE |
| Cluster History | |||||
|---|---|---|---|---|---|
| Number of Clusters |
Clusters Joined | Freq | Norm Minimum Distance |
Tie | |
| 9 | New York | Washington D.C. | 2 | 0.1447 | |
| 8 | Los Angeles | San Francisco | 2 | 0.2449 | |
| 7 | Atlanta | CL9 | 3 | 0.3832 | |
| 6 | CL7 | Chicago | 4 | 0.4142 | |
| 5 | CL6 | Miami | 5 | 0.4262 | |
| 4 | CL8 | Seattle | 3 | 0.4784 | |
| 3 | CL5 | Houston | 6 | 0.4947 | |
| 2 | Denver | CL4 | 4 | 0.5864 | |
| 1 | CL3 | CL2 | 10 | 0.6203 | |
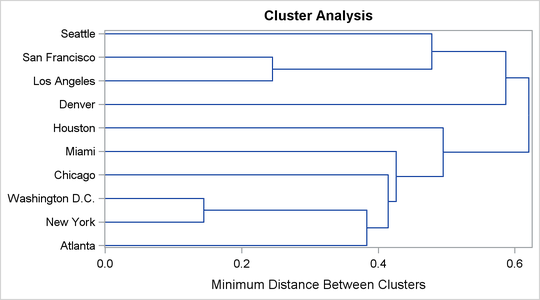
Output 33.1.9: Dendrogram Using METHOD=SINGLE
A partial listing from the following statements include Output 33.1.10 and Output 33.1.11:
title2 'Using METHOD=TWOSTAGE K=3';
proc cluster data=sashelp.mileages(type=distance) method=twostage k=3;
   id City;
run;
Output 33.1.10: Cluster History Using METHOD=TWOSTAGE K=3
| Cluster Analysis of Flying Mileages Between 10 American Cities |
| Using METHOD=TWOSTAGE K=3 |
| Cluster History | |||||||
|---|---|---|---|---|---|---|---|
| Number of Clusters |
Freq | Normalized Fusion Density |
Maximum Density in Each Cluster |
Tie | |||
| Clusters Joined | Lesser | Greater | |||||
| 9 | Atlanta | Washington D.C. | 2 | 96.106 | 92.5043 | 100.0 | |
| 8 | CL9 | Chicago | 3 | 95.263 | 90.9548 | 100.0 | |
| 7 | CL8 | New York | 4 | 86.465 | 76.1571 | 100.0 | |
| 6 | CL7 | Miami | 5 | 74.079 | 58.8299 | 100.0 | T |
| 5 | CL6 | Houston | 6 | 74.079 | 61.7747 | 100.0 | |
| 4 | Los Angeles | San Francisco | 2 | 71.968 | 65.3430 | 80.0885 | |
| 3 | CL4 | Seattle | 3 | 66.341 | 56.6215 | 80.0885 | |
| 2 | CL3 | Denver | 4 | 63.509 | 61.7747 | 80.0885 | |
| 1 | CL5 | CL2 | 10 | 61.775 | 80.0885 | 100.0 | |
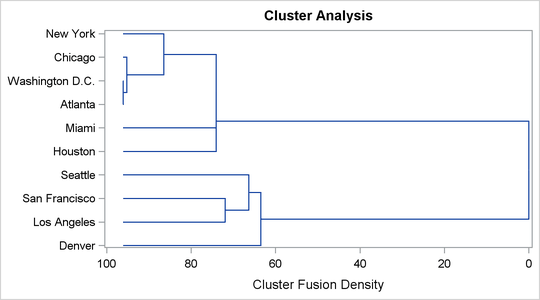
Output 33.1.11: Dendrogram Using METHOD=TWOSTAGE K=3
A partial listing from the following statements include Output 33.1.12 and Output 33.1.13:
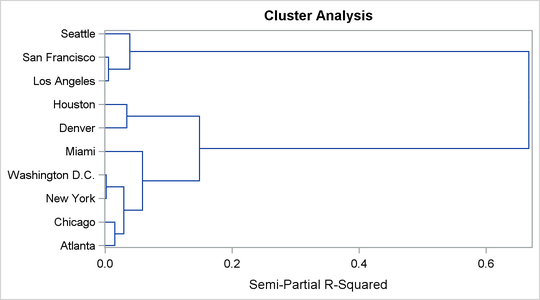
title2 'Using METHOD=WARD';
proc cluster data=sashelp.mileages(type=distance) method=ward pseudo;
   id City;
run;
Output 33.1.12: Cluster History Using METHOD=WARD
| Cluster Analysis of Flying Mileages Between 10 American Cities |
| Using METHOD=WARD |
| Cluster History | ||||||||
|---|---|---|---|---|---|---|---|---|
| Number of Clusters |
Clusters Joined | Freq | Semipartial R-Square |
R-Square | Pseudo F Statistic |
Pseudo t-Squared |
Tie | |
| 9 | New York | Washington D.C. | 2 | 0.0019 | .998 | 66.7 | . | |
| 8 | Los Angeles | San Francisco | 2 | 0.0054 | .993 | 39.2 | . | |
| 7 | Atlanta | Chicago | 2 | 0.0153 | .977 | 21.7 | . | |
| 6 | CL7 | CL9 | 4 | 0.0296 | .948 | 14.5 | 3.4 | |
| 5 | Denver | Houston | 2 | 0.0344 | .913 | 13.2 | . | |
| 4 | CL8 | Seattle | 3 | 0.0391 | .874 | 13.9 | 7.3 | |
| 3 | CL6 | Miami | 5 | 0.0586 | .816 | 15.5 | 3.8 | |
| 2 | CL3 | CL5 | 7 | 0.1488 | .667 | 16.0 | 5.3 | |
| 1 | CL2 | CL4 | 10 | 0.6669 | .000 | . | 16.0 | |
Output 33.1.13: Dendrogram Using METHOD=WARD