The POWER Procedure
- Overview
-
Getting Started

-
Syntax
-
Details
-
ExamplesOne-Way ANOVAThe Sawtooth Power Function in Proportion AnalysesSimple AB/BA Crossover DesignsNoninferiority Test with Lognormal DataMultiple Regression and CorrelationComparing Two Survival CurvesConfidence Interval PrecisionCustomizing PlotsBinary Logistic Regression with Independent PredictorsWilcoxon-Mann-Whitney Test
- References
You can use the VARY option in the PLOT statement to specify which of the following features you want to associate with analysis parameters.
-
line style
-
plotting symbol
-
color
-
panel
You can specify mappings between each of these features and one or more analysis parameters, or you can simply choose a subset of these features to use (and rely on default settings to associate these features with multiple-valued analysis parameters).
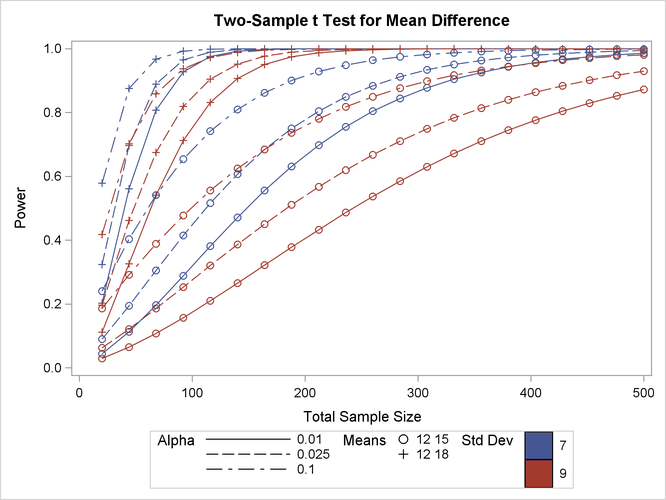
Suppose you supplement the sample size analysis in Output 71.8.5 to include three values of alpha, by using the following statements:
proc power plotonly;
   twosamplemeans test=diff
      groupmeans   = 12 | 15 18
      stddev       = 7 9
      alpha        = 0.01 0.025 0.1
      power        = .
      ntotal       = 100;
   plot x=n min=20 max=500;
run;
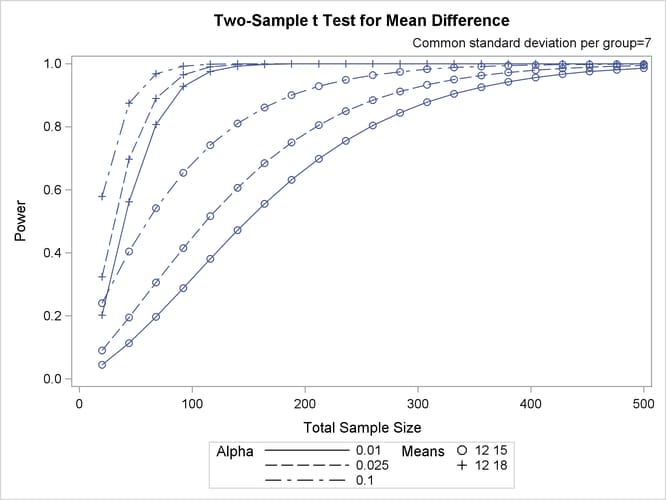
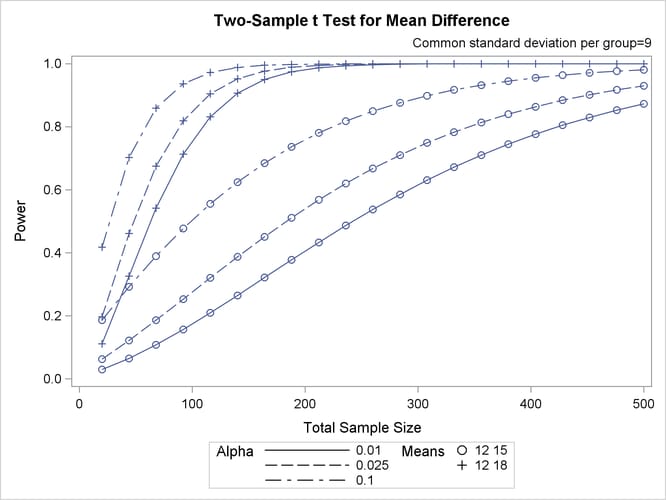
The defaults for the VARY option in the PLOT statement specify line style varying by the ALPHA= parameter, plotting symbol varying by the GROUPMEANS= parameter, panel varying by the STDDEV= parameter, and color remaining constant. The resulting plot, consisting of two panels, is shown in Output 71.8.14.
Suppose you want to produce a plot with only one panel that varies color in addition to line style and plotting symbol. Include the LINESTYLE, SYMBOL, and COLOR keywords in the VARY option in the PLOT statement, as follows, to produce the plot in Output 71.8.15:
   plot x=n min=20 max=500
      vary (linestyle, symbol, color);
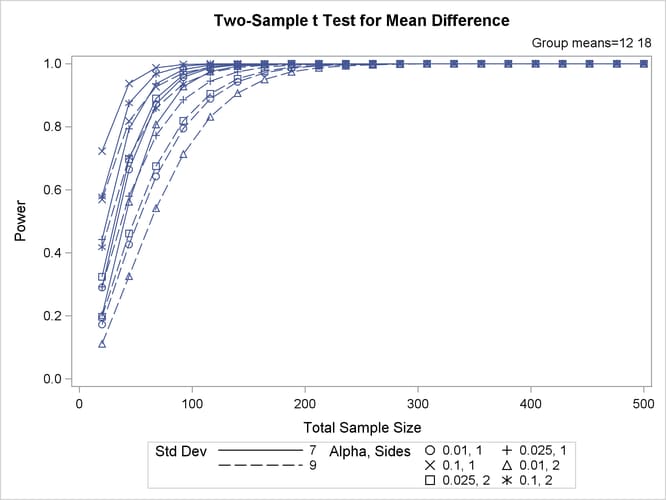
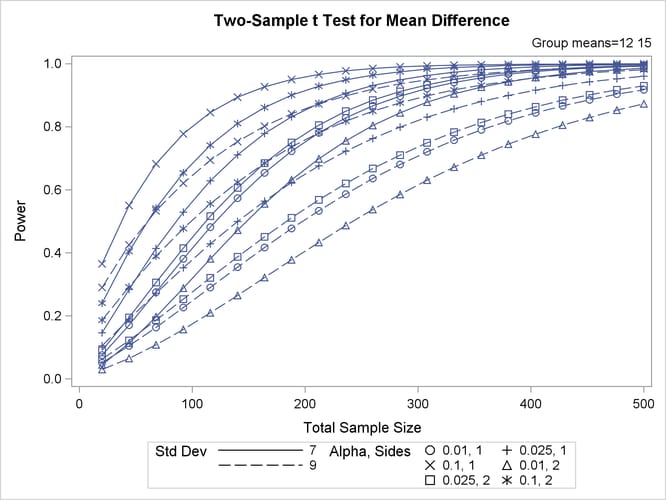
Finally, suppose you want to specify which features are used and which analysis parameters they are linked to. The following PLOT statement produces a two-panel plot (shown in Output 71.8.16) in which line style varies by standard deviation, plotting symbol varies by both alpha and sides, and panel varies by means:
   plot x=n min=20 max=500
      vary (linestyle by stddev,
            symbol by alpha sides,
            panel by groupmeans);