The POWER Procedure
- Overview
-
Getting Started

-
Syntax
-
Details
-
ExamplesOne-Way ANOVAThe Sawtooth Power Function in Proportion AnalysesSimple AB/BA Crossover DesignsNoninferiority Test with Lognormal DataMultiple Regression and CorrelationComparing Two Survival CurvesConfidence Interval PrecisionCustomizing PlotsBinary Logistic Regression with Independent PredictorsWilcoxon-Mann-Whitney Test
- References
You are consulting for a clinical research group planning a trial to compare survival rates for proposed and standard cancer
treatments. The planned data analysis is a log-rank test to nonparametrically compare the overall survival curves for the
two treatments. Your goal is to determine an appropriate sample size to achieve a power of 0.8 for a two-sided test with ![]() = 0.05 by using a balanced design.
= 0.05 by using a balanced design.
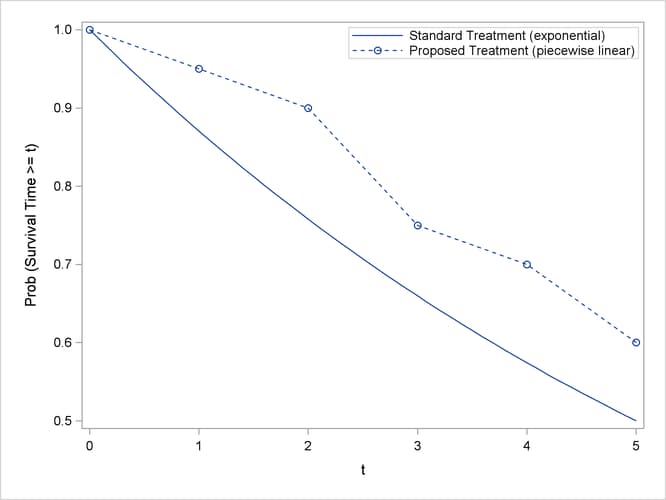
The survival curve for patients on the standard treatment is well known to be approximately exponential with a median survival time of five years. The research group conjectures that the new proposed treatment will yield a (nonexponential) survival curve similar to the dashed line in Output 71.6.1.
Patients will be accrued uniformly over two years and then followed for an additional three years past the accrual period. Some loss to follow-up is expected, with roughly exponential rates that would result in about 50% loss with the standard treatment within 10 years. The loss to follow-up with the proposed treatment is more difficult to predict, but 50% loss would be expected to occur sometime between years 5 and 20.
Use the TWOSAMPLESURVIVAL statement with the TEST=LOGRANK option to compute the required sample size for the log-rank test. The following statements perform the analysis:
proc power;
   twosamplesurvival test=logrank
      curve("Standard") = 5 : 0.5
      curve("Proposed") = (1 to 5 by 1):(0.95 0.9 0.75 0.7 0.6)
      groupsurvival = "Standard" | "Proposed"
      accrualtime = 2
      followuptime = 3
      groupmedlosstimes = 10 | 20 5
      power = 0.8
      npergroup = .;
run;
The CURVE= option defines the two survival curves. The “Standard” curve has only one point, specifying an exponential form with a survival probability of 0.5 at year 5. The “Proposed” curve is a piecewise linear curve defined by the five points shown in Output 71.6.1. The GROUPSURVIVAL= option assigns the survival curves to the two groups, and the ACCRUALTIME= and FOLLOWUPTIME= options specify the accrual and follow-up times. The GROUPMEDLOSSTIMES= option specifies the years at which 50% loss is expected to occur. The POWER= option specifies the target power, and the NPERGROUP=. option identifies sample size per group as the parameter to compute. Default values for the SIDES= and ALPHA= options specify a two-sided test with ![]() = 0.05.
= 0.05.
Output 71.6.2 shows the results.
Output 71.6.2: Sample Size Determination for Log-Rank Test
| Fixed Scenario Elements | |
|---|---|
| Method | Lakatos normal approximation |
| Accrual Time | 2 |
| Follow-up Time | 3 |
| Group 1 Survival Curve | Standard |
| Form of Survival Curve 1 | Exponential |
| Group 2 Survival Curve | Proposed |
| Form of Survival Curve 2 | Piecewise Linear |
| Group 1 Median Loss Time | 10 |
| Nominal Power | 0.8 |
| Number of Sides | 2 |
| Number of Time Sub-Intervals | 12 |
| Alpha | 0.05 |
| Computed N Per Group | |||
|---|---|---|---|
| Index | Median Loss Time 2 |
Actual Power | N Per Group |
| 1 | 20 | 0.800 | 228 |
| 2 | 5 | 0.801 | 234 |
The required sample size per group to achieve a power of 0.8 is 228 if the median loss time is 20 years for the proposed treatment. Only six more patients are required in each group if the median loss time is as short as five years.