| The PHREG Procedure |
Overview: PHREG Procedure
The analysis of survival data requires special techniques because the data are almost always incomplete, and familiar parametric assumptions might be unjustifiable. Investigators follow subjects until they reach a prespecified endpoint (for example, death). However, subjects sometimes withdraw from a study, or the study is completed before the endpoint is reached. In these cases, the survival times (also known as failure times) are censored; subjects survived to a certain time beyond which their status is unknown. The uncensored survival times are sometimes referred to as event times. Methods of survival analysis must account for both censored and uncensored data.
Many types of models have been used for survival data. Two of the more popular types of models are the accelerated failure time model (Kalbfleisch and Prentice; 1980) and the Cox proportional hazards model (Cox; 1972). Each has its own assumptions about the underlying distribution of the survival times. Two closely related functions often used to describe the distribution of survival times are the survivor function and the hazard function (see the section Failure Time Distribution for definitions). The accelerated failure time model assumes a parametric form for the effects of the explanatory variables and usually assumes a parametric form for the underlying survivor function. Cox’s proportional hazards model also assumes a parametric form for the effects of the explanatory variables, but it allows an unspecified form for the underlying survivor function.
The PHREG procedure performs regression analysis of survival data based on the Cox proportional hazards model. Cox’s semiparametric model is widely used in the analysis of survival data to explain the effect of explanatory variables on hazard rates.
The survival time of each member of a population is assumed to follow its own hazard function,  , expressed as
 |
where  is an arbitrary and unspecified baseline hazard function,
  is the vector of explanatory variables for the
  th individual, and
  is the vector of unknown regression parameters associated with the explanatory variables. The vector is assumed to be the same for all individuals. The survivor function can be expressed as
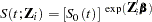 |
where 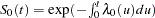 is the baseline survivor function. To estimate , Cox (1972, 1975) introduced the partial likelihood function, which eliminates the unknown baseline hazard and accounts for censored survival times.
The partial likelihood of Cox also allows time-dependent explanatory variables. An explanatory variable is time-dependent if its value for any given individual can change over time. Time-dependent variables have many useful applications in survival analysis. You can use a time-dependent variable to model the effect of subjects changing treatment groups. Or you can include time-dependent variables such as blood pressure or blood chemistry measures that vary with time during the course of a study. You can also use time-dependent variables to test the validity of the proportional hazards model.
An alternative way to fit models with time-dependent explanatory variables is to use the counting process style of input. The counting process formulation enables PROC PHREG to fit a superset of the Cox model, known as the multiplicative hazards model. This extension also includes recurrent events data and left truncation of failure times. The theory of these models is based on the counting process pioneered by Andersen and Gill (1982), and the model is often referred to as the Andersen-Gill model.
Multivariate failure time data arise when each study subject can potentially experience several events (for instance, multiple infections after surgery) or when there exists some natural or artificial clustering of subjects (for instance, a litter of mice) that induces dependence among the failure times of the same cluster. Data in the former situation are referred to as multiple events data, which include recurrent events data as a special case; data in the latter situation are referred to as clustered data. You can use PROC PHREG to carry out various methods of analyzing these data.
The population under study can consist of a number of subpopulations, each of which has its own baseline hazard function. PROC PHREG performs a stratified analysis to adjust for such subpopulation differences. Under the stratified model, the hazard function for the jth individual in the ith stratum is expressed as
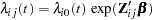 |
where  is the baseline hazard function for the ith stratum, and
  is the vector of explanatory variables for the individual. The regression coefficients are assumed to be the same for all individuals across all strata.
Ties in the failure times can arise when the time scale is genuinely discrete or when survival times generated from the continuous-time model are grouped into coarser units. The PHREG procedure includes four methods of handling ties. The discrete logistic model is available for discrete time-scale data. The other three methods apply to continuous time-scale data. The exact method computes the exact conditional probability under the model that the set of observed tied event times occurs before all the censored times with the same value or before larger values. Breslow and Efron methods provide approximations to the exact method.
Variable selection is a typical exploratory exercise in multiple regression when the investigator is interested in identifying important prognostic factors from a large number of candidate variables. The PHREG procedure provides four selection methods: forward selection, backward elimination, stepwise selection, and best subset selection. The best subset selection method is based on the likelihood score statistic. This method identifies a specified number of best models containing one, two, or three variables and so on, up to the single model containing all of the explanatory variables.
The PHREG procedure also enables you to include an offset variable in the model; to weight the observations in the input data; to test linear hypotheses about the regression parameters; to perform conditional logistic regression analysis for matched case-control studies; to output survivor function estimates, residuals, and regression diagnostics; and to estimate the survivor function for a new set of covariates.
PROC PHREG can also be used to fit the multinomial logit choice model to discrete choice data. See http://support.sas.com/resources/papers/tnote/tnote_marketresearch.html for more information about discrete choice modeling and the multinomial logit model. Look for the "Discrete Choice" report.
The PHREG procedure now uses ODS Graphics to create graphs as part of its output. For example, the ASSESS statement uses a graphical method that uses ODS Graphics to check the adequacy of the model. See Chapter 21, Statistical Graphics Using ODS, for general information about ODS Graphics.
There have been a number of enhancements to PROC PHREG with this release. The most noticeable additions are the CLASS statement for specifying categorical variables; the CONTRAST statement for estimating and testing linear contrasts; the BAYES statement for performing a Bayesian analysis; and the HAZARDRATIO statement for estimating customized hazard ratios.
The CLASS statement enables you to specify categorical variables (also known as factors or CLASS variables) to be used in the analysis. Model effects, including covariates, main effects (CLASS variables), crossed effects (interactions), and nested effects, can be specified in the same way as in the GLM procedure. The CLASS statement supports less-than-full-rank parameterization as in the GLM procedure as well as various full-rank parameterization methods such as reference coding, effect coding, and orthogonal polynomial coding. For some of the full-rank coding schemes, you can designate a specific value (category or level) of the CLASS variable as the reference level. The CLASS statement also enables you to specify the ordering of the categories of CLASS variables, to reverse the ordering of the categories, and to treat categories with missing values as valid categories.
With the new way of specifying model effects, the CONTRAST statement enables you to test customized hypotheses concerning the regression parameters. Each CONTRAST statement also provides estimation of individual rows of contrasts, which is particularly useful in comparing the hazards between the categories of a CLASS variable.
The BAYES statement invokes a Bayesian analysis of the Cox model or the piecewise constant baseline hazard model (also known as the piecewise exponential model ). In essence, the Bayesian paradigm treats parameters as random variables, and inference (measurement of uncertainty) about parameters is based on the posterior distribution of the parameters. A posterior distribution is a weighted likelihood function of the data with a prior distribution that uses the Bayes theorem. Without any past experience or knowledge of what prior distribution to use, you can always start with a noninformative prior. Knowledge of the prior is accumulated over time, and the Bayesian approach can be viewed as a process of learning from experience. A closed form of the posterior distribution is hard to come by, and a Markov chain Monte Carlo method is used to simulate samples from the posterior distribution. See Chapter 7, Introduction to Bayesian Analysis Procedures, for an introduction to the basic concepts in Bayesian statistics. You can also refer to the section Bayesian Analysis: Advantages and Disadvantages for a discussion of the advantages and disadvantages of Bayesian analysis. For the Cox model, the partial likelihood is used as the likelihood, which is justified by Sinha, Ibrahim, and Chen (2003). PROC PHREG generates a chain of posterior distribution samples by the Gibbs sampler, using the adaptive rejection sampling algorithm (Gilks and Wild; 1992; Gilks, Best, and Tan; 1995) to sample each parameter value from its full conditional distribution. Summary statistics (mean, standard deviation, percentiles, HPD intervals, and equal-tail credible intervals) and convergence diagnostics (autocorrelations; Gelman-Rubin, Geweke, Raftery-Lewis, and Heidelberger-Welch tests; and the effective sample size) are computed for each parameter, as well as the covariance and correlation matrices of the posterior samples. Trace plots, posterior density plots, and autocorrelation function plots are also provided using ODS Graphics.
The HAZARDRATIO statement identifies the variable for which hazard ratios are to be evaluated. For a continuous variable, the hazard ratio compares the hazards for a given change in the variable. For a CLASS variable, a hazard ratio compares the hazards of two levels of the variable. The HAZARDRATIO statement enables you to obtain hazard ratios even in the presence of interactions and nested effects.
Other enhancements include plotting the baseline functions through ODS Graphics, computing profile-likelihood-based confidence limits for hazard ratios, and allowing the bias-reducing penalized likelihood optimization as discussed by Firth (1993) and Heinze and Schemper (2001).
For both the BASELINE and OUTPUT statements, the default method of estimating a survivor function is now based on the Breslow (1972) estimator—that is, METHOD=CH. There are a few other changes in the BASELINE statement with this release. The option NOMEAN in the past releases has become obsolete—that is, requested statistics at the sample average values of the covariates are no longer computed and added to the OUT= data set. However, if the COVARIATES= data set is not specified, the requested statistics are computed and output for the covariate set that consists of the reference levels for the CLASS variables and sample averages for the continuous variable. In addition to the requested statistics, the OUT= data set also contains all variables in the COVARIATES= data set.
The remaining sections of this chapter contain information about how to use PROC PHREG, information about the underlying statistical methodology, and some sample applications of the procedure. The section Getting Started: PHREG Procedure introduces PROC PHREG with two examples. The section Syntax: PHREG Procedure describes the syntax of the procedure. The section Details: PHREG Procedure summarizes the statistical techniques employed in PROC PHREG. The section Examples: PHREG Procedure includes eight additional examples of useful applications. Experienced SAS/STAT software users might decide to proceed to the "Syntax" section, while other users might choose to read both the "Getting Started" and "Examples" sections before proceeding to "Syntax" and "Details."
Copyright © 2009 by SAS Institute Inc., Cary, NC, USA. All rights reserved.