The HPNLMOD Procedure

- Performance Information
- Specifications
- Number of Observations
- Dimensions
- Parameters
- Iteration History
- Convergence Status
- Linear Constraints
- Fit Statistics
- ANOVA
- Parameter Estimates
- Additional Estimates
- Covariance
- Correlation
- Additional Estimates Covariance
- Additional Estimates Correlation
- Procedure Task Timing
The following sections describe the output that PROC HPNLMOD produces by default. The output is organized into various tables, which are discussed in the order of their appearance.
The “Performance Information” table is produced by default. It displays information about the execution mode. For single-machine mode, the table displays the number of threads used. For distributed mode, the table displays the grid mode (symmetric or asymmetric), the number of compute nodes, and the number of threads per node.
If you specify the DETAILS option in the PERFORMANCE statement, the procedure also produces a “Timing” table in which elapsed times (absolute and relative) for the main tasks of the procedure are displayed.
The “Specifications” table displays basic information about the model such as the data source, the dependent variable, the distribution being modeled, and the optimization technique.
The “Number of Observations” table displays the number of observations that are read from the input data set and the number of observations that are used in the analysis.
The “Dimensions” table displays the number of parameters that are estimated in the model and the number of upper and lower bounds that are imposed on the parameters.
The “Parameters” table displays the initial values of parameters that are used to start the estimation process. You can limit this information by specifying the BEST= option in the PARAMETERS statement when you specify a large number of initial parameter value combinations. The parameter combinations and their corresponding objective function values are listed in increasing order of objective function value.
For each iteration of the optimization, the “Iteration History” table displays the number of function evaluations (including gradient and Hessian evaluations), the value of the objective function, the change in the objective function from the previous iteration, and the absolute value of the largest (projected) gradient element.
The convergence status table is a small ODS table that follows the “Iteration History” table in the default output. In the listing it appears as a message that identifies whether the optimization succeeded and
which convergence criterion was met. If the optimization fails, the message indicates the reason for the failure. If you save
the convergence status table to an output data set, a numeric Status variable is added that enables you to programmatically assess convergence. The values of the Status variable encode the following:
- 0
-
Convergence was achieved or an optimization was not performed because TECHNIQUE=NONE.
- 1
-
The objective function could not be improved.
- 2
-
Convergence was not achieved because of a user interrupt or because a limit (such as the maximum number of iterations or the maximum number of function evaluations) was reached. To modify these limits, see the MAXITER=, MAXFUNC=, and MAXTIME= options in the PROC HPNLMOD statement.
- 3
-
Optimization failed to converge because function or derivative evaluations failed at the starting values or during the iterations or because a feasible point that satisfies the parameter constraints could not be found in the parameter space.
The “Linear Constraints” table summarizes the linear constraints that are applied to the model by using the RESTRICT statements. All the constraints that are specified in the model are listed in the “Linear Constraints” table, together with information about whether each constraint represents an inequality or equality condition and whether that constraint is active for the final parameter estimates.
The “Fit Statistics” table displays a variety of measures of fit, depending on whether the model was estimated using least squares or maximum likelihood. In both cases, smaller values of the fit statistics indicate better fit.
For least squares estimations, the “Fit Statistics” table displays the sum of squares of errors and the variance of errors.
For maximum likelihood estimations, the table uses the following formulas to display information criteria, where ![]() denotes the number of effective parameters,
denotes the number of effective parameters, ![]() denotes the number of observations used, and
denotes the number of observations used, and ![]() is the log likelihood that is evaluated at the converged estimates:
is the log likelihood that is evaluated at the converged estimates:
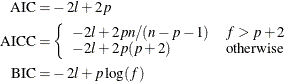
The information criteria values that are displayed in the “Fit Statistics” table are not based on a normalized log-likelihood function.
The “Analysis of Variance” table is displayed only for least squares estimations. The ANOVA table displays the number of
degrees of freedom and the sum of squares that are attributed to the model, the error, and the total. The ANOVA table also
reports the variance of the model and the errors, the ![]() statistic, and its probability for the model.
statistic, and its probability for the model.
The “Parameter Estimates” table displays the parameter estimates, their estimated (asymptotic) standard errors ![]() statistics, and associated
statistics, and associated ![]() -values for the hypothesis that the parameter is 0. Confidence limits are displayed for each parameter and are based on the
value of the ALPHA= option in the PROC HPNLMOD statement.
-values for the hypothesis that the parameter is 0. Confidence limits are displayed for each parameter and are based on the
value of the ALPHA= option in the PROC HPNLMOD statement.
The “Additional Estimates” table displays the same information as the “Parameter Estimates” table for the expressions that appear in the optional ESTIMATE statements. The table is generated when one or more ESTIMATE statements are specified. Because a separate ALPHA= option can be specified for each ESTIMATE statement, the “Additional Estimates” table also includes a column that indicates each confidence interval’s corresponding significance level.
The “Covariance” table appears when the COV option is specified in the PROC HPNLMOD statement. The “Covariance” table displays a matrix of covariances between each pair of estimated parameters.
The “Correlation” table appears when the CORR option is specified in the PROC HPNLMOD statement. The “Correlation” table displays the correlation matrix for the estimated parameters.
The “Covariance of Additional Estimates” table appears when the ECOV option is specified in the PROC HPNLMOD statement. The “Covariance of Additional Estimates” table displays a matrix of covariances between each pair of expressions that are specified in ESTIMATE statements.
The “Correlation of Additional Estimates” table appears when the ECORR option is specified in the PROC HPNLMOD statement. The “Correlation of Additional Estimates” table displays the correlation matrix for the expressions that are specified in ESTIMATE statements.
If you specify the DETAILS option in the PERFORMANCE statement, the procedure also produces a “Procedure Task Timing” table in which elapsed times (absolute and relative) for the main tasks of the procedure are displayed.