| Exploring Data in Three Dimensions |
Exploring Data in Three Dimensions
SAS/INSIGHT software provides rotating plots, surface plots, and contour plots for exploring data in three dimensions. A rotating plot is a three-dimensional scatter plot, so it shows a graphic representation of the relationship among three interval variables. A surface plot is a rotating plot with a surface that models a third variable as a function of two other variables. A contour plot shows how the values of one variable may depend on the values of two other variables.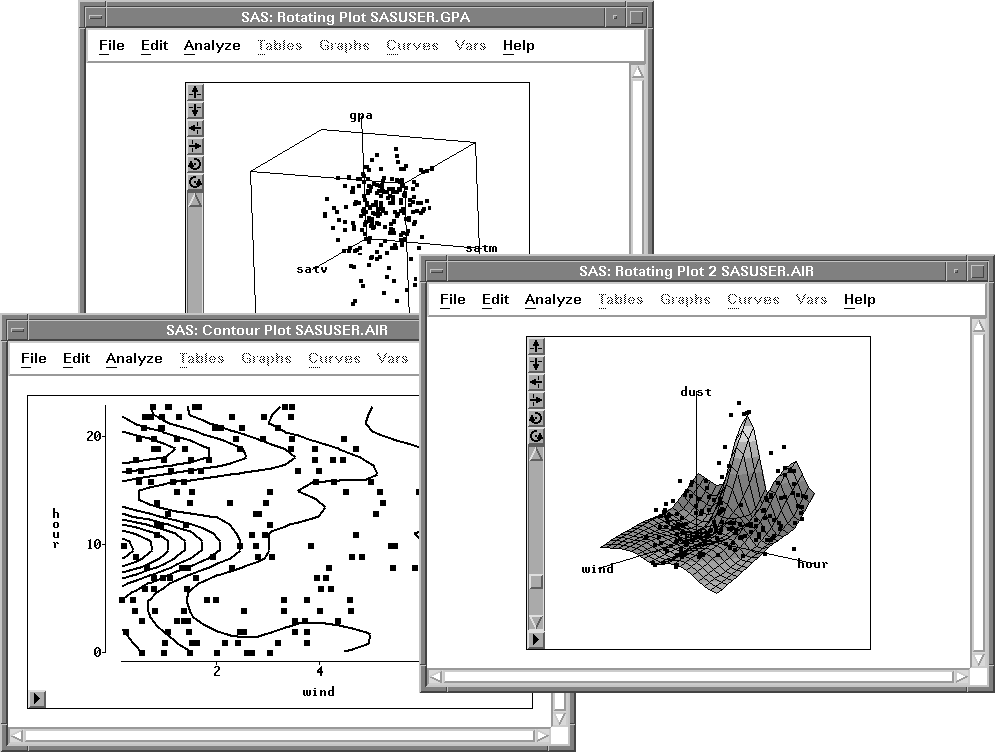
Figure 6.1: A Rotating Plot, Surface Plot, and Contour Plot