Method
Observations with missing values for Z, Y, X variables are not used.
If there are observations that all share the same values for the X and Y variables, then the mean Z value of the set is used for the purpose of fitting a surface to the data set.
Clicking on the Method button in the variables dialog displays the dialog in Figure 37.3.
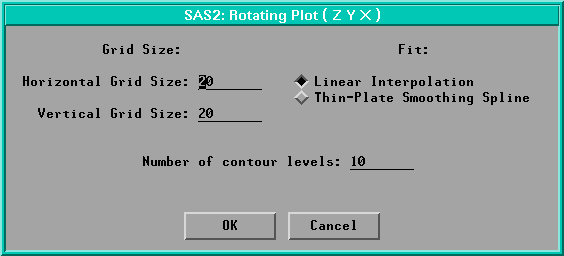
Figure 37.3: Rotating Plot Methods Dialog
| |
| Grid Size: Horizontal Size |
specifies the horizontal resolution of the rectangular grid over which surface and ZColor functions are evaluated. |
| Grid Size: Vertical Size |
specifies the vertical resolution of the rectangular grid over which surface and ZColor functions are evaluated. |
| Fit:Linear Interpolation |
linearly interpolates surface and ZColor functions across rectangular grid cells. |
| Fit:Thin-Plate Smoothing Spline |
fits surface and ZColor functions over the rectangular grid using thin-plate smoothing spline fitting. The process may be much slower than linear interpolation. It usually produces very smooth surfaces and colors.
|
| Number of Contour Levels |
specifies the number of contour levels to be drawn on the surface. The contour levels are spaced evenly within the range of the ZColor variable, or the range of the Z variable if no ZColor variable is specified. |
Copyright © 2007 by SAS Institute Inc., Cary, NC, USA. All rights reserved.