| Rotating Plot |
Variables
To create a rotating plot, choose Analyze:Rotating Plot ( Z Y X ). If you have already selected three or more variables, a rotating plot for each unique triplet of variables appears. If you have not selected any variables, a variables dialog appears.
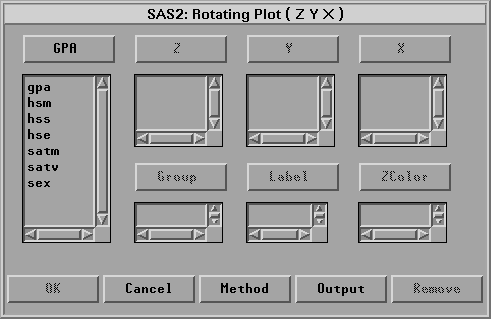
Figure 37.2: Rotating Plot Variables Dialog
In the dialog, select at least one Z, Y, X variable. If you select more than three variables, you obtain a matrix of rotating plots.
You can select one or more Group variables if you have grouped data. This creates rotating plots for each group.
You can select a Label variable for labeling observations in the plots.
To create a surface plot, select the Fit Surface option in the Output dialog as shown in Figure 37.3. If the X variable and Y variable are the same, you get a rotating plot without surface.
You can select one or more ZColor variables to color surfaces. This creates surface plots for each color variable. The hues in the multiple colors button in the tools window are applied to the surface, according to interpolated values of the ZColor variable.
Copyright © 2007 by SAS Institute Inc., Cary, NC, USA. All rights reserved.