| Rotating Plot |
Rotating Plot
A rotating plot is a graphic representation of the relationships among three variables. Rotating plots enable you to see structure in the data that is not apparent in two- dimensional scatter plots. Surface characteristics and general dependencies of one variable on the other two variables can be brought out by the three-dimensional representation (Becker, Cleveland, and Weil 1989).
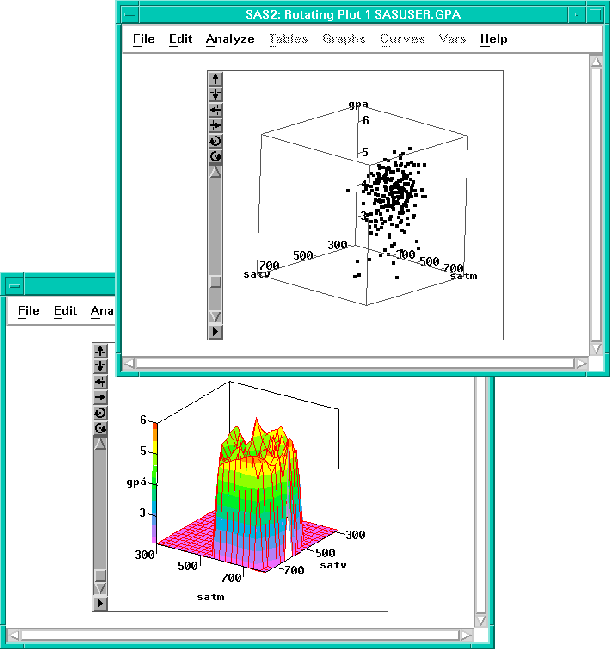
Figure 37.1: Rotating Plot
A surface plot is a rotating plot with a fit surface. It is a graphic representation of the relationships among three or four variables. A fourth variable can be used to color surface contours along Z direction in three-dimensional space. You can use linear interpolation or a thin-plate smoothing spline to fit surface functions.
Various drawing modes are provided to view a surface. For example, you can interactively color contour levels, and you can control the resolution of the rectangular grid used to compute a fitted surface.
You can toggle the display of axes and rays in any rotating plot. You can add a bounding cube to the display to show the range of the data and to provide perspective to the axes. You can adjust parameters that control depth cueing, the use of color, and the algorithm used for rotation.