| Examining Distributions |
Kernel Density Curve
A kernel density curve may follow the shape of the distribution more closely. To construct a normal kernel density curve, one parameter is required: the bandwidth ![]() .The value of
.The value of ![]() determines the degree of smoothing in the estimate of the density function. You can either specify a value of
determines the degree of smoothing in the estimate of the density function. You can either specify a value of ![]() , or you can let SAS/INSIGHT software find a value based on minimizing an estimate of the mean integrated square error (MISE).
, or you can let SAS/INSIGHT software find a value based on minimizing an estimate of the mean integrated square error (MISE).
| Choose Curves:Kernel Density. |
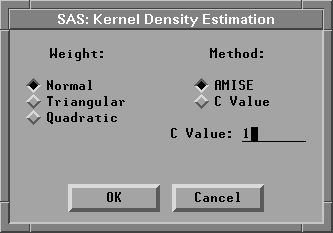
Figure 12.16: Kernel Density Estimation Dialog
| Click OK in the dialog. |
The kernel density curve is constructed with a bandwidth based on the approximated mean integrated square error (AMISE), and it provides a good visual representation of the distribution, as illustrated in Figure 12.17. A table containing the bandwidth and the AMISE is also added to the window.
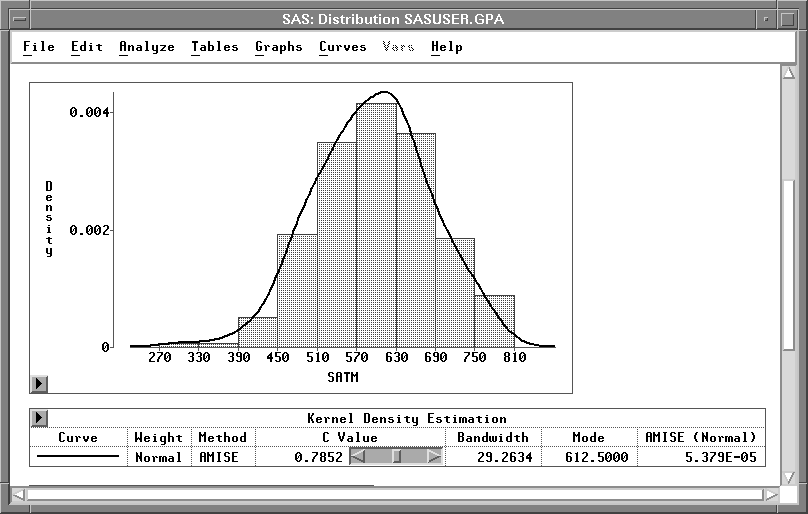
Figure 12.17: Kernel Density Estimate
The C Value slider in the table can be used to change the C value of the kernel estimate. You can use the slider in three ways:
- click the arrow buttons
- click within the slider
- drag within the slider
| Click the left arrow button in the slider. |
This decreases the C value by half. As the C value decreases, the density estimate becomes less smooth, as illustrated in Figure 12.18.
| Click within the slider, just to the right of the slider control. |
This moves the slider control to the position where you click. The C value is set to a value proportional to the slider position. On most personal computers, clicking within the slider is the fastest way to adjust a curve.
| Drag the slider control left and right. |
When you drag the slider, its speed depends on the number of data points, the type of curve, and the speed of your host. Depending on your host, you may be able to improve the speed of the dynamic graphics with an alternate drawing algorithm. To try this, choose Edit:Windows:Graph Options, and set the Fast Draw option.
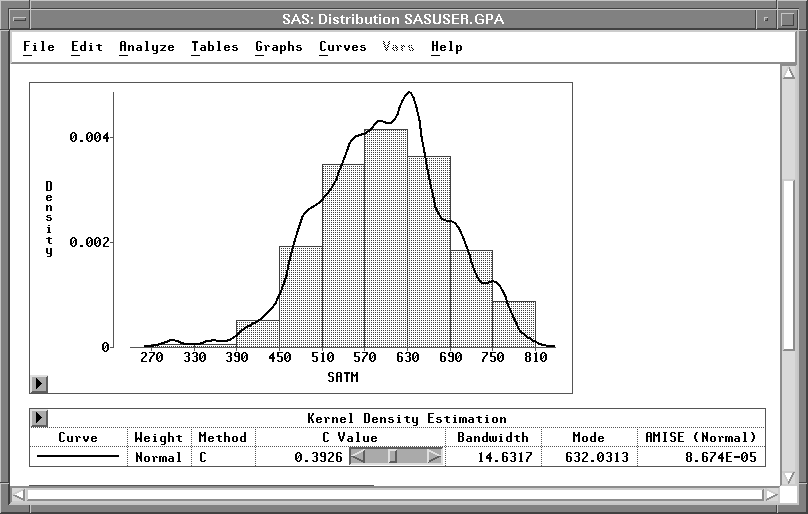
Figure 12.18: Kernel Density Estimate with a Smaller C Value
Copyright © 2007 by SAS Institute Inc., Cary, NC, USA. All rights reserved.