| Examining Distributions |
Normal Density Curve
Begin by adding a normal density curve.| Choose Curves:Parametric Density. |
![[menu]](images/exd_exdeq3.gif)
Figure 12.13: Normal Density Menu
This displays the parametric density estimation dialog in Figure 12.14. You can select one of four distribution families, and you can use sample parameter estimates or you can specify your own.
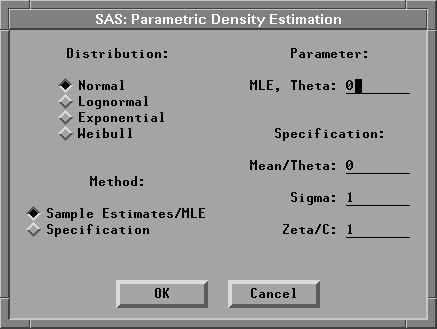
Figure 12.14: Parametric Density Estimation Dialog
| Click OK in the dialog. |
This requests the default density estimate: a normal distribution using the sample estimates as parameter values. The density curve is superimposed on the histogram, as illustrated in Figure 12.15.
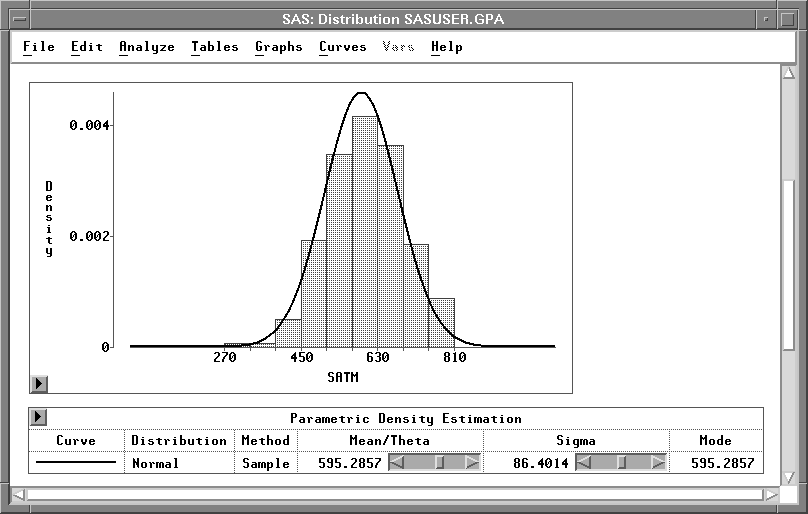
Figure 12.15: Parametric Normal Density Estimation
In addition, a Parametric Density Estimation table that contains parameter information appears in the window. You can change the specified parameters and the corresponding curve using the sliders next to the parameter values.
Note that the values of Mean / Theta and Sigma are equal to the sample Mean and Std Dev displayed in the Moments table illustrated in Figure 12.12. The density curve follows the shape of the distribution fairly well.
| Select the density curve. |
You can select the curve by clicking on either the curve in the histogram or the legend on the table. Both the curve and the legend become highlighted.
| Choose Edit:Delete. |
The selected curve and its associated table are deleted from the window.
Copyright © 2007 by SAS Institute Inc., Cary, NC, USA. All rights reserved.