| Distribution Analyses |
Histogram/Bar Chart
The histogram is the most widely used density estimator, and it is shown in Figure 38.19. You can also display bar charts for nominal variables, as shown in Figure 38.37.
Related Reading |
Bar Charts, Chapter 32. |
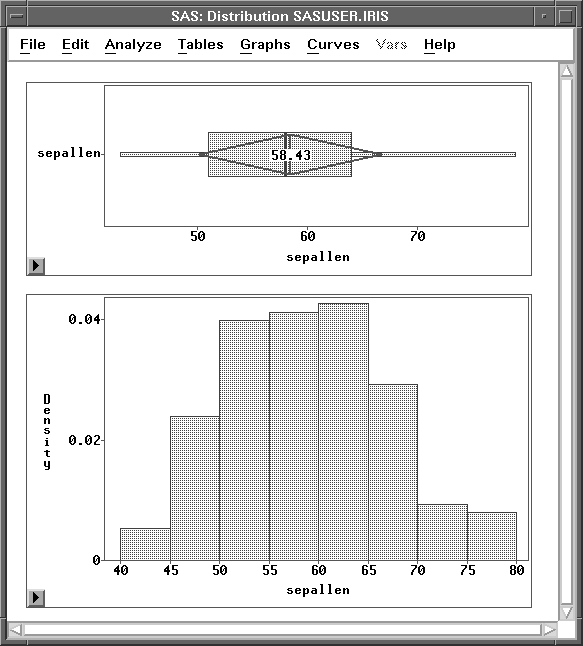
Figure 38.19: Box Plot and Histogram
Copyright © 2007 by SAS Institute Inc., Cary, NC, USA. All rights reserved.