| Distribution Analyses |
Analysis for Nominal Variables
You can generate a frequency table, display a bar chart, and display a mosaic plot for each nominal variable in the distribution analysis, as shown in Figure 38.37.
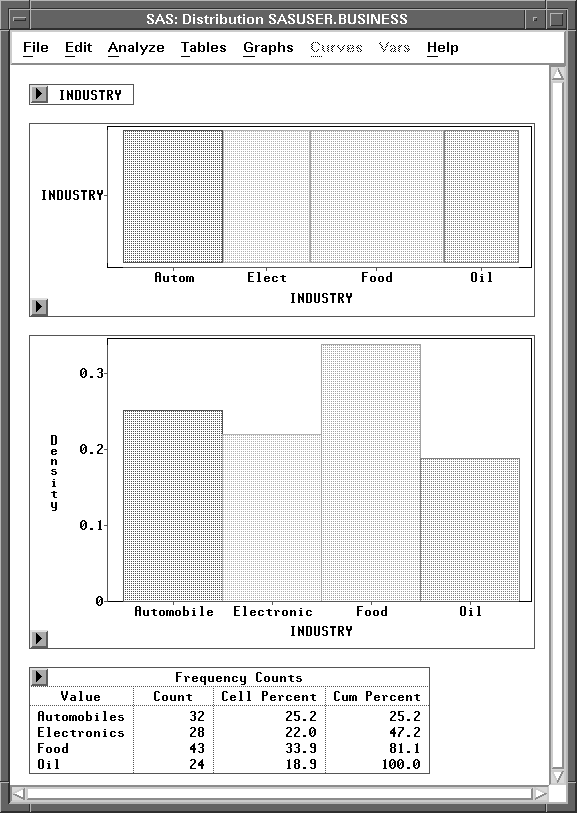
Figure 38.37: Nominal Variable Output
Related Reading |
Bar Charts, Chapter 32. |
Related Reading |
Mosaic Plots, Chapter 33. |
Copyright © 2007 by SAS Institute Inc., Cary, NC, USA. All rights reserved.