| Fitting Curves |
Parametric Regression Fits
Fitting a curve produces a visual display that reflects the systematic variation of the data. In this section, you will fit polynomial curves using a subset of the MINING data set described in Chapter 1, "Getting Started."
| Open the MININGX data set. |
| Choose Analyze:Fit ( Y X ). |
![[menu]](images/cur_cureq1.gif)
The fit variables dialog appears, as shown in Figure 13.3.
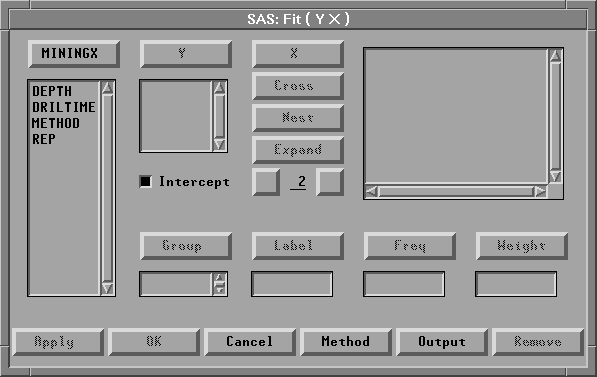
Figure 13.3: Fit Variables Dialog
| Select the variable DRILTIME, then click the Y button. |
DRILTIME appears in the Y variables list.
| Select the variable DEPTH, then click the X button. |
DEPTH appears in the X variables list.
| Click the Output button. |
The fit output options dialog, shown in Figure 13.4, appears on your display.
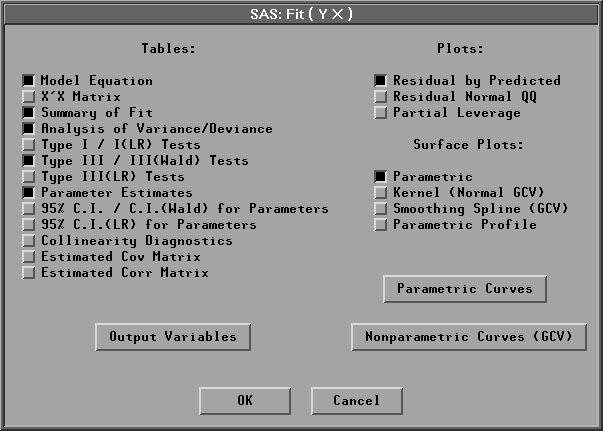
Figure 13.4: Fit Output Options Dialog
In the output options dialog, you specify which curves and tables will appear in the fit window. The default curve is a polynomial of degree one, that is, a line. The options set by default in this dialog are appropriate aids to a careful modeling of the data. They are not needed here where the purpose is to produce a visual display that reflects the trend of the data.
| Turn off all check boxes by clicking on any that are highlighted. |
| Click the OK button in all dialogs. |
A fit window appears, as shown in Figure 13.5.
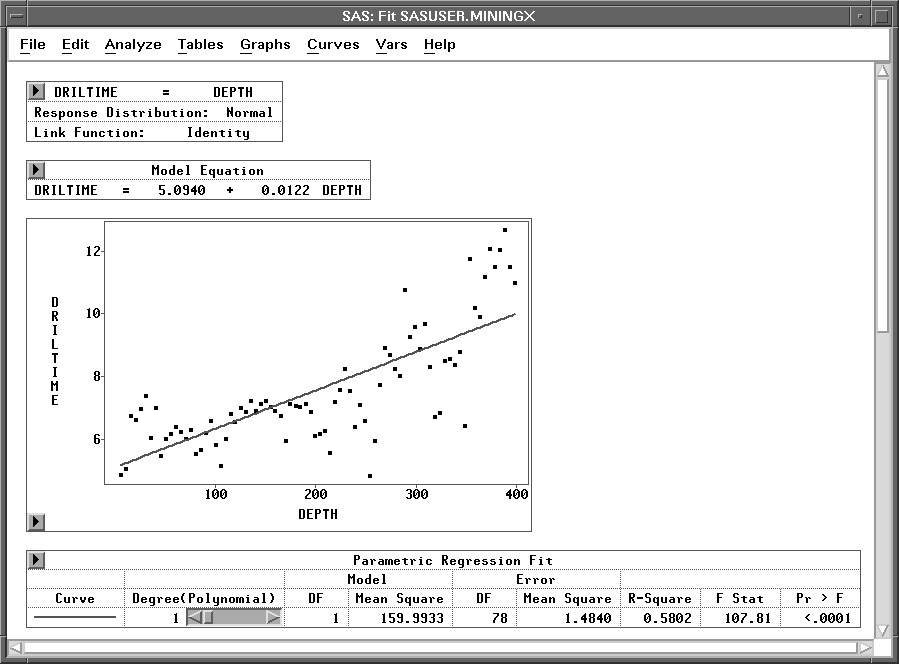
Figure 13.5: Fit Window with Line
The fit window contains a plot of DRILTIME by DEPTH along with a table summarizing the fit. A simple regression line is superimposed on the plot; it follows the linear trend of the data. Notice, though, that the plot shows curvature that a straight line cannot follow.
First examine the Parametric Regression Fit table corresponding to these data. The R-Square value is 0.5802, which means that 58% of the variation in drilling times is explained by DEPTH. The rest of this table contains statistics pertinent to hypothesis testing, and they are discussed in Chapter 14, "Multiple Regression."
Changing the Polynomial Degree
Adding Curves
Line Colors, Patterns, and Widths
Copyright © 2007 by SAS Institute Inc., Cary, NC, USA. All rights reserved.