| Fitting Curves |
Line Colors, Patterns, and Widths
Notice in Figure 13.10 that it is difficult to distinguish the two polynomial curves. On color displays, curve colors are chosen by default to contrast with the window background color and with existing curves. Curves are always drawn as solid lines by default. You can set default curve widths with display options. You can use the Tools window to change any of these curve features.
| Choose Edit:Windows:Tools to display the tools window. |
The tools window displays a palette of colors, three line patterns, and five curve widths that you can choose for the selected curve, as shown in Figure 13.11
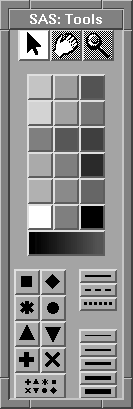
Figure 13.11: Tools Window
| Click on the cubic fit curve legend to select the curve. |
Clicking on either the legend or the curve highlights both the legend and the curve.
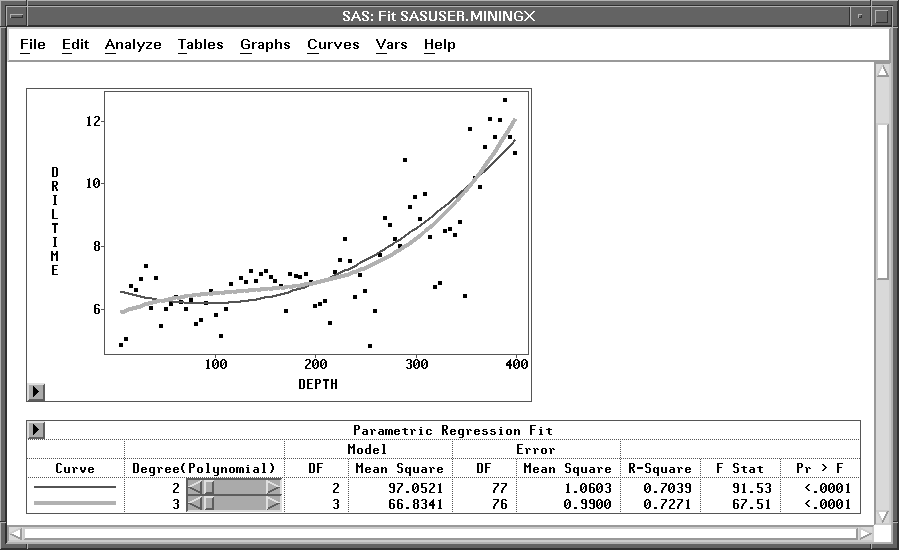
Figure 13.12: Cubic Fit Curve Selected
| In the Tools window, click on the dotted line pattern. |
Again note that the legend in the table matches the new curve pattern.

Figure 13.13: New Pattern for Cubic Fit
| Click in any blank area of the fit window to deselect the curve. |
You can select a curve again and try various colors, patterns, or widths.
| Select the Parametric Regression Fit table. |
| Choose Edit:Delete. |
The selected parametric regression fit table and its associated curves are deleted from the window.
Copyright © 2007 by SAS Institute Inc., Cary, NC, USA. All rights reserved.