| Fitting Curves |
Adding Curves
You can add curves to a scatter plot in the fit window in two ways. You can choose from the Curves menu or you can select Edit:Windows:Renew to reset the fit output options. When you add a curve from the Curves menu, SAS/INSIGHT adds either a new table entry or a whole new table that contains a summary of the new curve fit. Suppose you want to compare polynomial fits of different degree directly on the scatter plot. Begin by adding a second polynomial fit to the plot.
| Choose Curves:Polynomial. |
![[menu]](images/cur_cureq2.gif)
This displays the polynomial fit dialog shown in Figure 13.9.
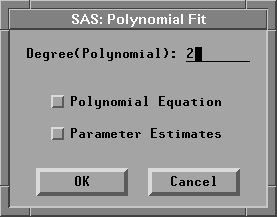
Figure 13.9: Polynomial Fit Dialog
| Set the degree for the new polynomial to 3 and click OK. |
This adds a cubic polynomial fit to the scatter plot, as shown in Figure 13.10.
Now you have two polynomial fits in the window. Note that an entry for the cubic polynomial has been added to the Parametric Regression Fit table. Each entry in the table has its own slider so that you can adjust the degree of either polynomial to compare any pair of fits.
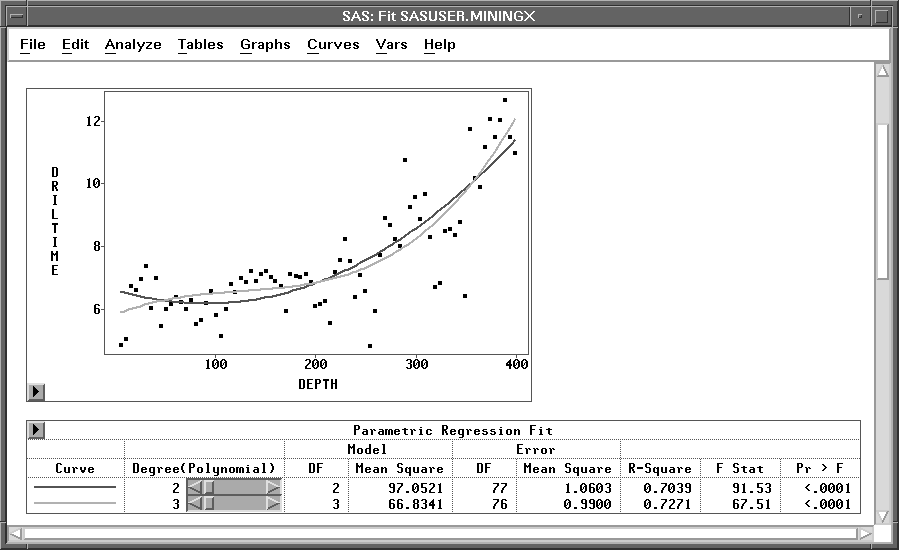
Figure 13.10: Fit Window with Two Polynomial Fits
Copyright © 2007 by SAS Institute Inc., Cary, NC, USA. All rights reserved.