| Fitting Curves |
Changing the Polynomial Degree
Examine the Parametric Regression Fit table in Figure 13.6. Note that next to the polynomial degree is a slider that enables you to change the degree of polynomial fit to try to account for the curvature in the plot not explained by the straight line.
You can use the slider in three ways to adjust curves:
- click the arrow buttons
- click within the slider
- drag within the slider
| Click the left arrow button in the slider. |
This decreases the degree of the polynomial to zero. A zero-degree polynomial fit is just a mean line.
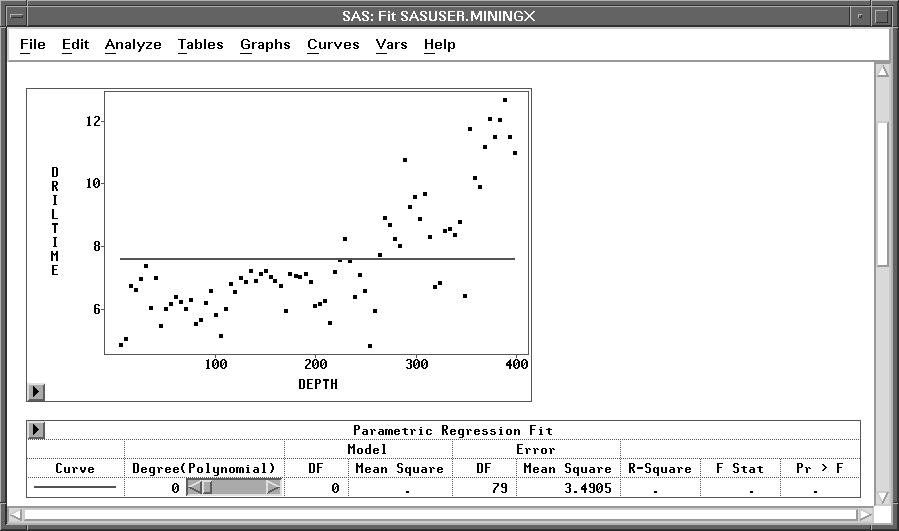
Figure 13.6: Fit Window with Mean Line
| Click twice on the right arrow button in the slider. |
This increases the polynomial degree to 2, a quadratic fit, as shown in Figure 13.7. The quadratic fit does a much better job accounting for the curvature in the plot. Note also that the R-Square value for the quadratic polynomial has increased to over 70%. You can fit successively higher-degree polynomials that continue to increase the R-Square value; but beyond a certain degree, small increases in R-Square do not compensate for the intuitive appeal in fitting a low degree polynomial.
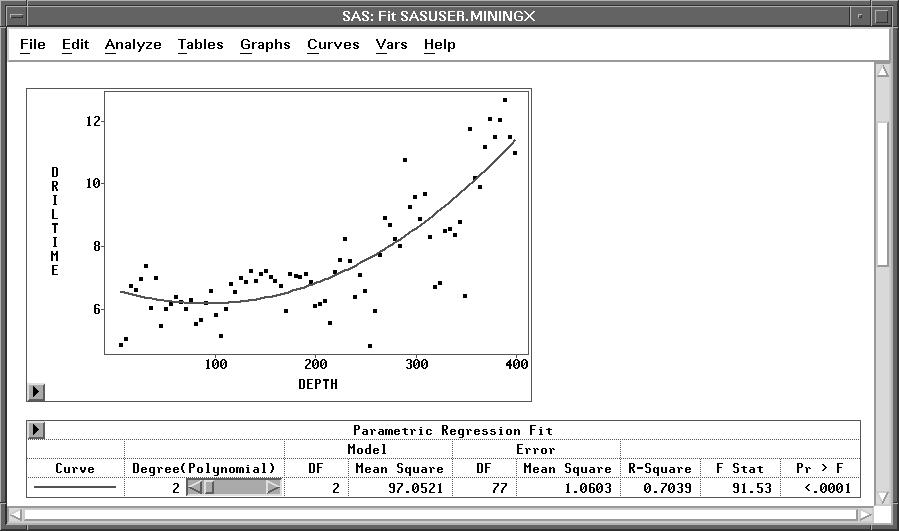
Figure 13.7: Quadratic Fit
| Click within the slider, just to the right of the slider control. |
This moves the slider control to the position where you click. The polynomial degree is set to a value proportional to the slider position. On most personal computers, clicking within the slider is the fastest way to adjust a curve.
| Drag the slider control left and right. |
When you drag the slider, its speed depends on the number of data points, the type of curve, and the speed of your host. Depending on your host, you may be able to improve the speed of the dynamic graphics with an alternate drawing algorithm. To try this, choose Edit:Windows:Graph Options, and set the Fast Draw option.
Note |
The Degree(Polynomial) is the degree being specified in the polynomial fit, and the Model DF is the polynomial degree actually fitted. |
To avoid unnecessary computation, the maximum degree that can be actually fitted is not calculated, and the maximum Degree(Polynomial) in the slider is set to be the number of unique X variable values minus 1. When a polynomial term for the X variable in the specified polynomial fit is a linear combination of its lower polynomial terms, the Degree(Polynomial) will be greater than the Model DF; that is, the degree actually fitted is less than the degree specified in these cases..
Copyright © 2007 by SAS Institute Inc., Cary, NC, USA. All rights reserved.