| Contour Plot |
Method
Observations that have missing values for any of the Z, Y, X variables are not used.
If two or more observations have the same (x, y) values, their mean Z value is used as the Z value at point (x, y).
Clicking on the Method button in the variable dialog displays the dialog in Figure 36.3.
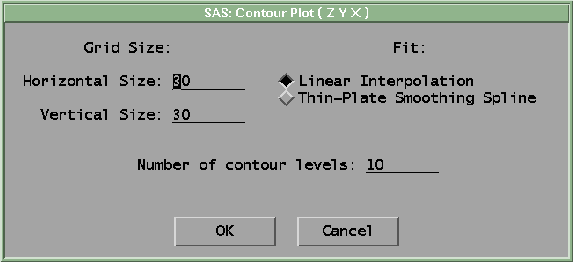
Figure 36.3: Contour Plot Method Dialog
| Grid Size: Horizontal Size | specifies the horizontal resolution of the rectangular grid over which contour function is evaluated. |
| Grid Size: Vertical Size | specifies the vertical resolution of the rectangular grid over which contour function is evaluated. |
| Fit:Linear Interpolation | linearly interpolates contour function across rectangular grid cells. |
| Fit:Thin-Plate Smoothing Spline | fits contour function over rectangular grid using thin-plate smoothing spline fitting. The process may be much slower than linear interpolation. It usually produces very smooth contours. See "Smoothing Spline Surface Plot" in Chapter 39, "Fit Analyses," for more information on thin-plate splines. |
| Number of Contour Levels | specifies the number of contour levels to be drawn in a contour plot. The contour levels are initially spaced evenly within the range of the Z variable. |
Copyright © 2007 by SAS Institute Inc., Cary, NC, USA. All rights reserved.