| Contour Plot |
Variables
To create a contour plot, choose Analyze:Contour Plot ( Z Y X ). If you have already selected three or more numeric variables, a contour plot for each unique triplet of variables appears. If you have not selected any variables, a variables dialog appears.
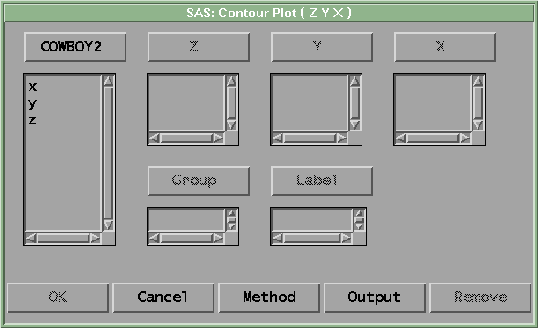
Figure 36.2: Contour Plot Variables Dialog
In the dialog, select at least one Z, Y, X variable. If you select more than three variables, you obtain a matrix of contour plots. If the X variable and Y variable are the same, you get a plot without contours.
You can select one or more Group variables if you have grouped data. This creates contour plots for each group.
You can select a Label variable for labeling observations in the plots.
Copyright © 2007 by SAS Institute Inc., Cary, NC, USA. All rights reserved.