| Contour Plot |
Contour Plot
A contour plot is a graphic representation of the relationships among three numeric variables in two dimensions. Two variables are for X and Y axes, and a third variable Z is for contour levels. The contour levels are plotted as curves; the area between curves can be color coded to indicate interpolated values.You can interactively identify, label, color, and move contour levels, and change the resolutions of rectangular grids to get better contouring quality and performance. You can choose linear interpolation or thin-plat smoothing spline to fit contour surface functions.
You can also toggle, identify and label observations in the contour plot, control the orientation of the plot, and control the information shown on the axes.
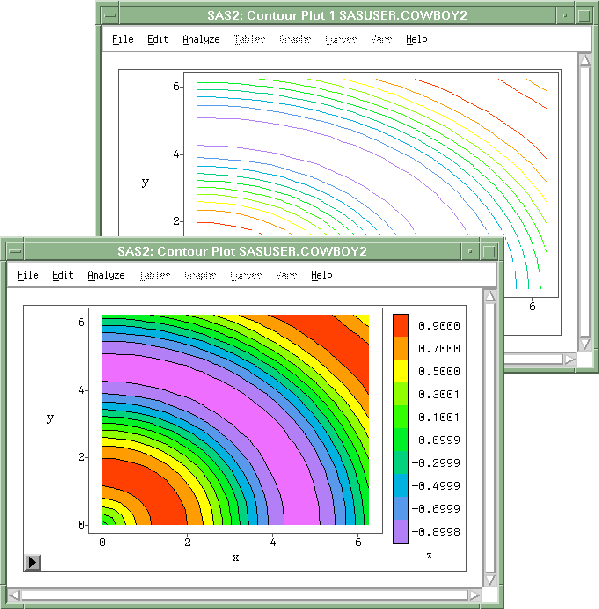
Figure 36.1: Contour Plot