| Adjusting Axes and Ticks |
Adjusting Axes and Ticks
With SAS/INSIGHT software, you have control over the appearance of axes. In all graphs, you can specify major and minor tick marks. In two-dimensional graphs, you can adjust axis position dynamically. In three-dimensional graphs, you can place axes at the center or the minimum of the data range.
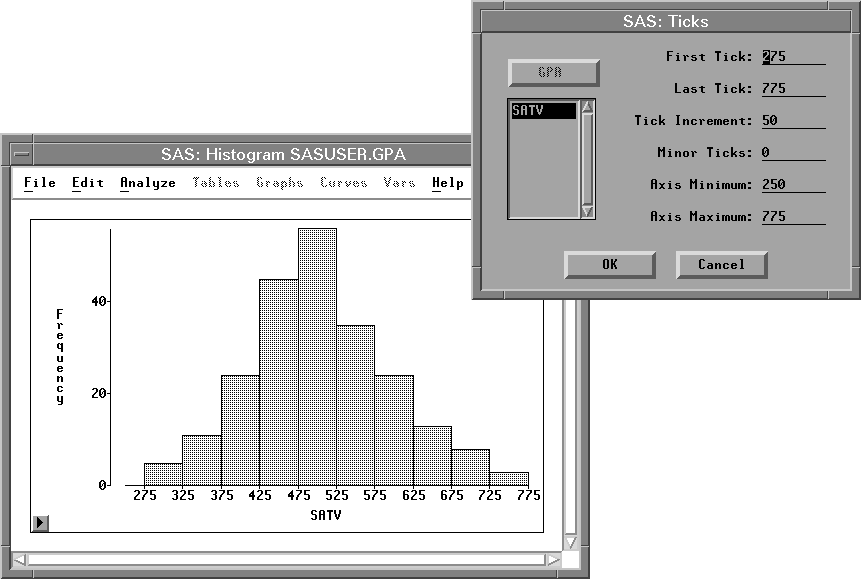
Figure 7.1: Adjusting Histogram Ticks