The RELIABILITY Procedure
- Overview
-
Getting Started
 Analysis of Right-Censored Data from a Single PopulationWeibull Analysis Comparing Groups of DataAnalysis of Accelerated Life Test DataWeibull Analysis of Interval Data with Common Inspection ScheduleLognormal Analysis with Arbitrary CensoringRegression ModelingRegression Model with Nonconstant ScaleRegression Model with Two Independent VariablesWeibull Probability Plot for Two Combined Failure ModesAnalysis of Recurrence Data on RepairsComparison of Two Samples of Repair DataAnalysis of Interval Age Recurrence DataAnalysis of Binomial DataThree-Parameter WeibullParametric Model for Recurrent Events DataParametric Model for Interval Recurrent Events Data
 -
SyntaxPrimary StatementsSecondary StatementsGraphical Enhancement StatementsPROC RELIABILITY StatementANALYZE StatementBY StatementCLASS StatementDISTRIBUTION StatementEFFECTPLOT StatementESTIMATE StatementFMODE StatementFREQ StatementINSET StatementLOGSCALE StatementLSMEANS StatementLSMESTIMATE StatementMAKE StatementMCFPLOT StatementMODEL StatementNENTER StatementNLOPTIONS StatementPROBPLOT StatementRELATIONPLOT StatementSLICE StatementSTORE StatementTEST StatementUNITID Statement
-
DetailsAbbreviations and NotationTypes of Lifetime DataProbability DistributionsProbability PlottingNonparametric Confidence Intervals for Cumulative Failure ProbabilitiesParameter Estimation and Confidence IntervalsRegression Model Statistics Computed for Each Observation for Lifetime DataRegression Model Statistics Computed for Each Observation for Recurrent Events DataRecurrence Data from Repairable SystemsODS Table NamesODS Graphics
- References
The following SAS statements fit a non-homogeneous Poisson process with a power intensity function model to the valve seat data described in the section Analysis of Recurrence Data on Repairs. The FIT=MODEL option in the MCFPLOT statement requests that the fitted model be plotted on the plot with the nonparametric mean cumulative function estimates.
proc reliability data=Valve;
   unitid id;
   distribution Nhpp(Pow);
   model   Days*Value(-1);
   mcfplot Days*Value(-1) / Fit=Model Noconf;
run;
The model parameter estimates are shown in Figure 16.49.
Figure 16.50 displays a plot of nonparametric estimates of the mean cumulative function and the fitted model mean function. The parametric model matches the data well except at the upper end of the range of repair times, where the parametric model does not capture the rapid increase in the number of replacements of the valve seats. For this reason, the parametric model might not be appropriate for predicting future repairs of the engines.
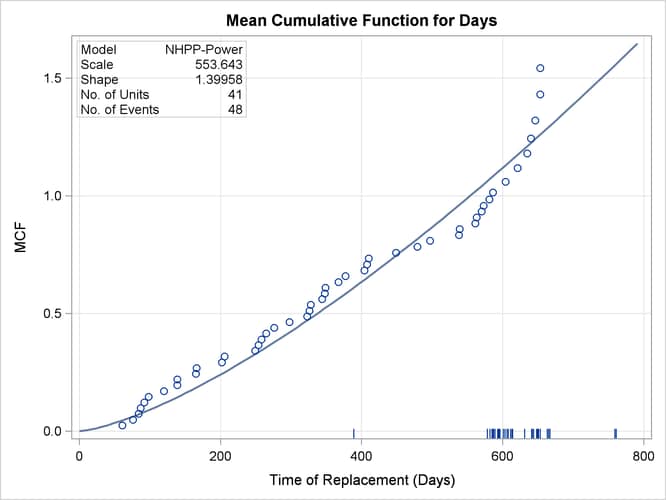
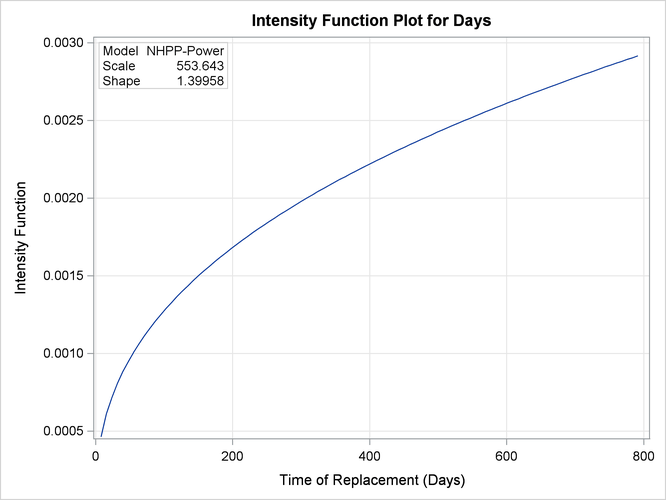
Figure 16.51 shows the parametric model intensity function. The intensity function increases with time, indicating an increasing rate of repairs. This is consistent with the parameter estimates in Figure 16.49, where a shape parameter significantly greater than 1 indicates an increasing failure rate.