The RELIABILITY Procedure
- Overview
-
Getting Started
 Analysis of Right-Censored Data from a Single PopulationWeibull Analysis Comparing Groups of DataAnalysis of Accelerated Life Test DataWeibull Analysis of Interval Data with Common Inspection ScheduleLognormal Analysis with Arbitrary CensoringRegression ModelingRegression Model with Nonconstant ScaleRegression Model with Two Independent VariablesWeibull Probability Plot for Two Combined Failure ModesAnalysis of Recurrence Data on RepairsComparison of Two Samples of Repair DataAnalysis of Interval Age Recurrence DataAnalysis of Binomial DataThree-Parameter WeibullParametric Model for Recurrent Events DataParametric Model for Interval Recurrent Events Data
 -
SyntaxPrimary StatementsSecondary StatementsGraphical Enhancement StatementsPROC RELIABILITY StatementANALYZE StatementBY StatementCLASS StatementDISTRIBUTION StatementEFFECTPLOT StatementESTIMATE StatementFMODE StatementFREQ StatementINSET StatementLOGSCALE StatementLSMEANS StatementLSMESTIMATE StatementMAKE StatementMCFPLOT StatementMODEL StatementNENTER StatementNLOPTIONS StatementPROBPLOT StatementRELATIONPLOT StatementSLICE StatementSTORE StatementTEST StatementUNITID Statement
-
DetailsAbbreviations and NotationTypes of Lifetime DataProbability DistributionsProbability PlottingNonparametric Confidence Intervals for Cumulative Failure ProbabilitiesParameter Estimation and Confidence IntervalsRegression Model Statistics Computed for Each Observation for Lifetime DataRegression Model Statistics Computed for Each Observation for Recurrent Events DataRecurrence Data from Repairable SystemsODS Table NamesODS Graphics
- References
Meeker and Escobar (1998, p. 447) analyzed data from an accelerated test on the lifetimes of glass capacitors as a function of operating voltage and temperature. The following SAS statements create a SAS data set containing the data. There are four lifetimes for each of eight combinations and four censored observations after the fourth failure for each combination:
data glass;
   input Temp Voltage @;
   do i = 1 to 4;
      cen = 0;
      input Hours @; output;
   end;
   do i = 1 to 4;
      cen = 1;
      output;
   end;
   datalines;
170 200  439  904  1092  1105
170 250  572  690   904  1090
170 300  315  315   439   628
170 350  258  258   347   588
180 200  959 1065  1065  1087
180 250  216  315   455   473
180 300  241  315   332   380
180 350  241  241   435   455
;
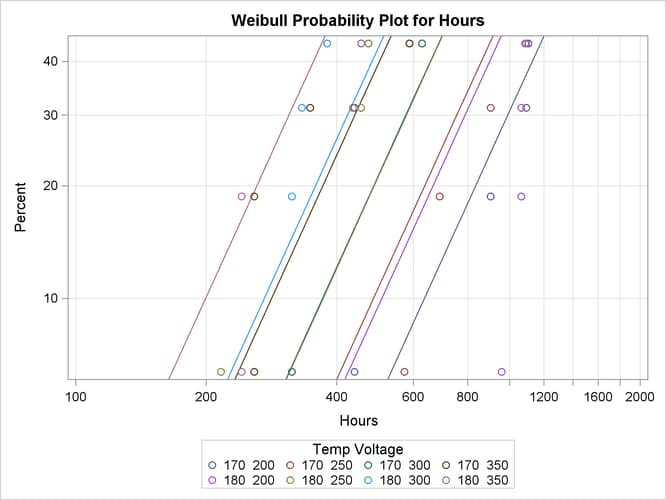
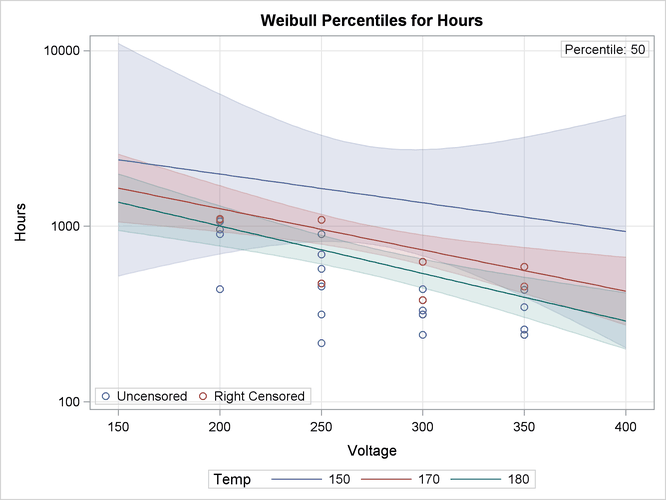
The following statements analyze the capacitor data. The MODEL statement fits a regression model with Temp and Voltage as independent variables. Parameter estimates from the fitted regression model are shown in Figure 16.24. An interaction term between Temp and Voltage is included. The PPLOT statement creates a Weibull probability plot shown in Figure 16.25 with all temperature-voltage combinations overlaid on the same plot. The regression model fit is also plotted. The RPLOT
statement creates the plot shown in Figure 16.26 of the data and Weibull distribution percentiles from the regression model as a function of voltage for values of temperature
of 150, 170, and 180:
proc reliability data = glass;
   distribution Weibull;
   model Hours*cen(1) = temp voltage temp * voltage;
   pplot Hours*cen(1) = ( temp voltage ) / fit = model
                                           overlay
                                           noconf
                                           lupper = 2000;
run;
proc reliability data = glass;
   distribution Weibull;
   model Hours*cen(1) = temp voltage temp * voltage;
   rplot Hours*cen(1) = voltage / fit = regression(temp = 150, 170, 180)
                                  plotfit;
run;
Figure 16.24: Parameter Estimates for Fitted Regression Model
| Weibull Parameter Estimates | ||||
|---|---|---|---|---|
| Parameter | Estimate | Standard Error |
Asymptotic Normal | |
| 95% Confidence Limits | ||||
| Lower | Upper | |||
| Intercept | 9.4135 | 10.5402 | -11.2449 | 30.0719 |
| Temp | -0.0062 | 0.0598 | -0.1235 | 0.1110 |
| Voltage | 0.0086 | 0.0374 | -0.0648 | 0.0820 |
| Temp*Voltage | -0.0001 | 0.0002 | -0.0005 | 0.0003 |
| EV Scale | 0.3624 | 0.0553 | 0.2687 | 0.4887 |
| Weibull Shape | 2.7593 | 0.4210 | 2.0461 | 3.7209 |