The RELIABILITY Procedure
- Overview
-
Getting Started
 Analysis of Right-Censored Data from a Single PopulationWeibull Analysis Comparing Groups of DataAnalysis of Accelerated Life Test DataWeibull Analysis of Interval Data with Common Inspection ScheduleLognormal Analysis with Arbitrary CensoringRegression ModelingRegression Model with Nonconstant ScaleRegression Model with Two Independent VariablesWeibull Probability Plot for Two Combined Failure ModesAnalysis of Recurrence Data on RepairsComparison of Two Samples of Repair DataAnalysis of Interval Age Recurrence DataAnalysis of Binomial DataThree-Parameter WeibullParametric Model for Recurrent Events DataParametric Model for Interval Recurrent Events Data
 -
SyntaxPrimary StatementsSecondary StatementsGraphical Enhancement StatementsPROC RELIABILITY StatementANALYZE StatementBY StatementCLASS StatementDISTRIBUTION StatementEFFECTPLOT StatementESTIMATE StatementFMODE StatementFREQ StatementINSET StatementLOGSCALE StatementLSMEANS StatementLSMESTIMATE StatementMAKE StatementMCFPLOT StatementMODEL StatementNENTER StatementNLOPTIONS StatementPROBPLOT StatementRELATIONPLOT StatementSLICE StatementSTORE StatementTEST StatementUNITID Statement
-
DetailsAbbreviations and NotationTypes of Lifetime DataProbability DistributionsProbability PlottingNonparametric Confidence Intervals for Cumulative Failure ProbabilitiesParameter Estimation and Confidence IntervalsRegression Model Statistics Computed for Each Observation for Lifetime DataRegression Model Statistics Computed for Each Observation for Recurrent Events DataRecurrence Data from Repairable SystemsODS Table NamesODS Graphics
- References
You can analyze recurrence data when the recurrence ages are grouped into intervals, instead of being exact ages. Figure 16.40 shows a listing of a SAS data set containing field data on replacements of defrost controls in 22,914 refrigerators, whose ages are grouped by months in service. Nelson (2002, problem 5.2, chapter 5) presents these data. Grouping the control data on the 22,914 refrigerators into age intervals enables you to represent the data by 29 data records, instead of requiring a single data record for each refrigerator, as required for exact recurrence data.
The variables Lower and Upper are the lower and upper monthly interval endpoints, Recurrences is the number of defrost control replacements in each month, and Censored is the number of refrigerator histories censored in each month—that is, the number with current age in the monthly interval.
Data are entered as shown in Figure 16.40.
Figure 16.40: Listing of the Defrost Controls Data
| Obs | Lower | Upper | Recurrences | Censored |
|---|---|---|---|---|
| 1 | 0 | 1 | 83 | 0 |
| 2 | 1 | 2 | 35 | 0 |
| 3 | 2 | 3 | 23 | 0 |
| 4 | 3 | 4 | 15 | 0 |
| 5 | 4 | 5 | 22 | 0 |
| 6 | 5 | 6 | 16 | 3 |
| 7 | 6 | 7 | 13 | 36 |
| 8 | 7 | 8 | 12 | 24 |
| 9 | 8 | 9 | 15 | 29 |
| 10 | 9 | 10 | 15 | 37 |
| 11 | 10 | 11 | 24 | 40 |
| 12 | 11 | 12 | 12 | 20041 |
| 13 | 12 | 13 | 7 | 14 |
| 14 | 13 | 14 | 11 | 17 |
| 15 | 14 | 15 | 15 | 13 |
| 16 | 15 | 16 | 6 | 28 |
| 17 | 16 | 17 | 8 | 22 |
| 18 | 17 | 18 | 9 | 27 |
| 19 | 18 | 19 | 9 | 64 |
| 20 | 19 | 20 | 5 | 94 |
| 21 | 20 | 21 | 6 | 119 |
| 22 | 21 | 22 | 6 | 118 |
| 23 | 22 | 23 | 6 | 138 |
| 24 | 23 | 24 | 5 | 1188 |
| 25 | 24 | 25 | 7 | 17 |
| 26 | 25 | 26 | 5 | 28 |
| 27 | 26 | 27 | 5 | 99 |
| 28 | 27 | 28 | 6 | 128 |
| 29 | 28 | 29 | 3 | 590 |
The following SAS statements create the plot of the sample MCF of defrost control replacement shown in Figure 16.41 and the tabular listing in Figure 16.42:
proc reliability data=defrost;
   mcfplot ( interval    = Lower Upper
             recurrences = Recurrences
             censor      = Censored ) / plotsymbol = X
                                        vaxis = 0 to .12 by .04
                                        interpolate = join;
run;
Pointwise confidence limits are included on the plot and in the tabular listing. These limits are approximate, and are usually shorter than the correct limits, which have not been developed for interval data.
Here, INTERVAL = LOWER UPPER specifies the input data set variables Lower and Upper as the age interval endpoints. The variable Recurrences identifies the number of recurrences (defrost control replacements) in each time interval, and Censored identifies the number of units censored in each interval (number in an age interval or removed from the sample in an age
interval).
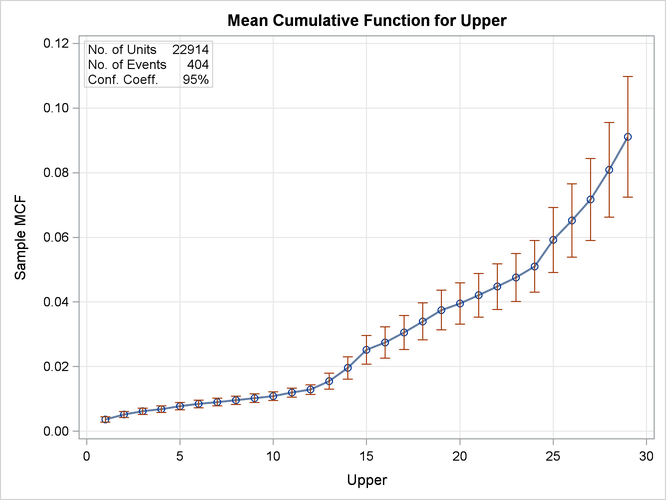
Figure 16.42: Listing of the Output for the Defrost Controls Data
| Recurrence Data Summary | |
|---|---|
| Input Data Set | WORK.DEFROST |
| Observations Used | 29 |
| Number of Units | 22914 |
| Number of Events | 404 |
| Recurrence Data Analysis | ||||||
|---|---|---|---|---|---|---|
| Endpoints | Sample MCF | Standard Error | Naive 95% Confidence Limits |
|||
| Lower | Upper | Lower | Upper | |||
| 0.00 | 1.00 | 0.004 | 0.000 | 0.003 | 0.004 | |
| 1.00 | 2.00 | 0.005 | 0.000 | 0.004 | 0.006 | |
| 2.00 | 3.00 | 0.006 | 0.001 | 0.005 | 0.007 | |
| 3.00 | 4.00 | 0.007 | 0.001 | 0.006 | 0.008 | |
| 4.00 | 5.00 | 0.008 | 0.001 | 0.007 | 0.009 | |
| 5.00 | 6.00 | 0.008 | 0.001 | 0.007 | 0.010 | |
| 6.00 | 7.00 | 0.009 | 0.001 | 0.008 | 0.010 | |
| 7.00 | 8.00 | 0.010 | 0.001 | 0.008 | 0.011 | |
| 8.00 | 9.00 | 0.010 | 0.001 | 0.009 | 0.012 | |
| 9.00 | 10.00 | 0.011 | 0.001 | 0.010 | 0.012 | |
| 10.00 | 11.00 | 0.012 | 0.001 | 0.011 | 0.013 | |
| 11.00 | 12.00 | 0.013 | 0.001 | 0.011 | 0.014 | |
| 12.00 | 13.00 | 0.015 | 0.001 | 0.013 | 0.018 | |
| 13.00 | 14.00 | 0.020 | 0.002 | 0.016 | 0.023 | |
| 14.00 | 15.00 | 0.025 | 0.002 | 0.021 | 0.030 | |
| 15.00 | 16.00 | 0.027 | 0.002 | 0.023 | 0.032 | |
| 16.00 | 17.00 | 0.031 | 0.003 | 0.025 | 0.036 | |
| 17.00 | 18.00 | 0.034 | 0.003 | 0.028 | 0.040 | |
| 18.00 | 19.00 | 0.038 | 0.003 | 0.031 | 0.044 | |
| 19.00 | 20.00 | 0.040 | 0.003 | 0.033 | 0.046 | |
| 20.00 | 21.00 | 0.042 | 0.003 | 0.035 | 0.049 | |
| 21.00 | 22.00 | 0.045 | 0.004 | 0.038 | 0.052 | |
| 22.00 | 23.00 | 0.048 | 0.004 | 0.040 | 0.055 | |
| 23.00 | 24.00 | 0.051 | 0.004 | 0.043 | 0.059 | |
| 24.00 | 25.00 | 0.059 | 0.005 | 0.049 | 0.069 | |
| 25.00 | 26.00 | 0.065 | 0.006 | 0.054 | 0.077 | |
| 26.00 | 27.00 | 0.072 | 0.006 | 0.059 | 0.084 | |
| 27.00 | 28.00 | 0.081 | 0.007 | 0.066 | 0.096 | |
| * | 28.00 | 29.00 | 0.091 | 0.010 | 0.072 | 0.110 |
| * The estimate and limits for this interval may not be appropriate. | ||||||
The last interval is always marked with a footnote indicating that estimates for the last interval may be biased since censoring ages often are not uniformly spread over that interval.