PCHART Statement: SHEWHART Procedure
Example 17.25 Creating a Chart with Revised Control Limits
See SHWPEX4 in the SAS/QC Sample LibraryThe following statements create a SAS data set named CircOne, which contains the number of failing circuits for 30 batches produced by the circuit manufacturing process introduced in
the section Getting Started: PCHART Statement:
data CircOne;
   input Batch Fail @@;
   datalines;
 1   7   2   6   3   6   4   9    5   2
 6  11   7   8   8   8   9   6   10  19
11   7  12   5  13   7  14   5   15   8
16  13  17   7  18  14  19  19   20   5
21   7  22   5  23   7  24   5   25  11
26   4  27   6  28   3  29  11   30   3
;
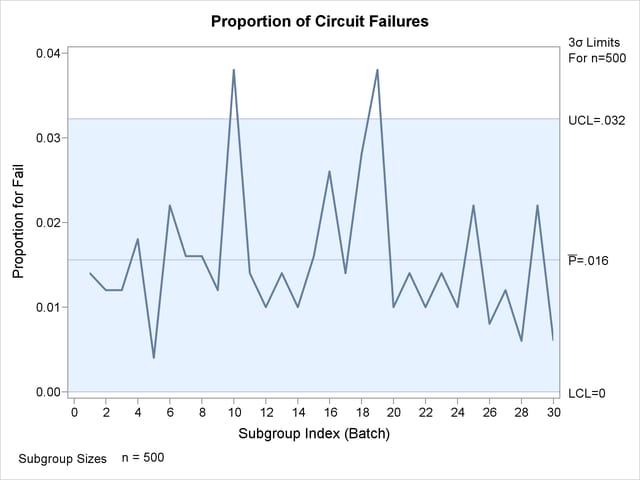
A p chart is used to monitor the proportion of failing circuits. The following statements create the chart shown in Output 17.25.1:
ods graphics on;
title 'Proportion of Circuit Failures';
proc shewhart data=CircOne;
   pchart Fail*Batch / subgroupn = 500
                       outindex  = 'Trial Limits'
                       outlimits = Faillim1
                       odstitle  = title;
run;
Output 17.25.1: A p Chart for Circuit Failures

Batches 10 and 19 have unusually high proportions of failing circuits. Subsequent investigation identifies special causes
for both batches, and it is decided to eliminate these batches from the data set and recompute the control limits. The following
statements create a data set named Faillim2 that contains the revised control limits:
proc shewhart data=CircOne;
   where Batch ^= 10 and Batch ^= 19;
   pchart Fail*Batch / subgroupn = 500
                       nochart
                       outindex  ='Revised Limits'
                       outlimits = Faillim2;
run;

data Faillims;
   set Faillim1 Faillim2;
run;
The data set Faillims, which contains the true and revised control limits, is listed in Output 17.25.2.
Output 17.25.2: Listing of the Data Set Faillims
| Proportion of Circuit Failures |
| _VAR_ | _SUBGRP_ | _INDEX_ | _TYPE_ | _LIMITN_ | _ALPHA_ | _SIGMAS_ | _LCLP_ | _P_ | _UCLP_ |
|---|---|---|---|---|---|---|---|---|---|
| Fail | Batch | Trial Limits | ESTIMATE | 500 | .005620297 | 3 | 0 | 0.0156 | 0.032226 |
| Fail | Batch | Revised Limits | ESTIMATE | 500 | .005942336 | 3 | 0 | 0.0140 | 0.029763 |
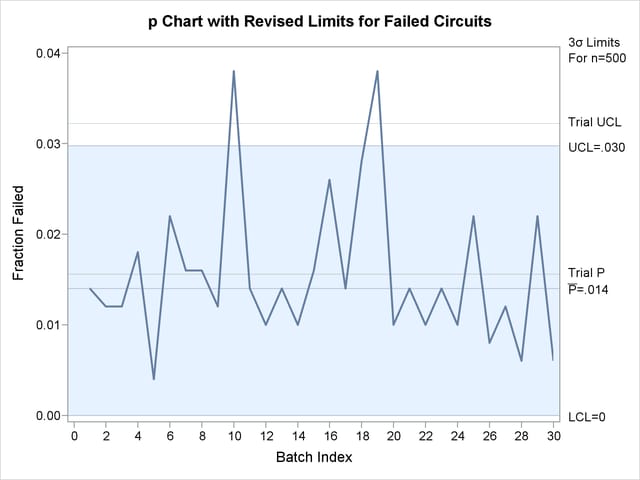
The following statements create a p chart displaying both sets of control limits:
title 'p Chart with Revised Limits for Failed Circuits';
proc shewhart data=CircOne limits=Faillims;
   pchart Fail*Batch / subgroupn  = 500
                       readindex  = 'Revised Limits'
                       vref       = 0.0156 0.032226
                       vreflabels = ('Trial P' 'Trial UCL')
                       vreflabpos = 3
                       odstitle   = title
                       nolegend;
   label Fail  = 'Fraction Failed'
         Batch = 'Batch Index';
run;
ods graphics off;
The READINDEX= option is used to select the revised limits displayed on the p chart in Output 17.25.3. See Displaying Multiple Sets of Control Limits. The VREF=, VREFLABELS=, and VREFLABPOS= options are used to display and label the trial limits. You can also pass in the values of the trial limits with macro variables. For an illustration of this technique, see Example 17.6.
Output 17.25.3: p Chart with Revised Limits

