BOXCHART Statement: SHEWHART Procedure
- Overview
-
Getting Started

-
Syntax
-
Details
-
ExamplesUsing Box Charts to Compare SubgroupsCreating Various Styles of Box-and-Whisker PlotsCreating Notched Box-and-Whisker PlotsCreating Box-and-Whisker Plots with Varying WidthsCreating Box-and-Whisker Plots with Different Line Styles and ColorsComputing the Control Limits for Subgroup MaximumsConstructing Multi-Vari Charts
Example 17.6 Computing the Control Limits for Subgroup Maximums
See SHWBOX3 in the SAS/QC Sample LibraryThis example illustrates how to compute and display control limits for the maximum of a subgroup sample. Subgroup samples of 20 metal braces are collected daily, and the lengths of the braces are measured
in centimeters. These data are analyzed extensively in Example 17.43. The box chart for LogLength (the log of length) shown in Output 17.43.3 indicates that the subgroup mean is in control and that the subgroup distributions of LogLength are approximately normal. The following statements save the control limits for the mean of the LogLength in a data set named LOGLLIMS:
data lengdata;
   set lengdata;
   LogLength=log(Length-105);
run;

proc shewhart data=lengdata;
   xchart LogLength*Day /
      nochart
      outlimits=logllims;
run;
The next statements replace the control limits for the mean of LogLength with control limits for the maximum of LogLength:
data maxlim;
   set lengdata;
   set logllims;
   drop expmax stdmax;
   label _lclx_ = 'Lower Limit for Maximum of 20'
         _uclx_ = 'Upper Limit for Maximum of 20'
         _mean_ = 'Central Line for Maximum of 20';
   expmax = _stddev_*1.86748 + _mean_;
   stdmax = _stddev_*0.52507;
   _lclx_ = expmax - _sigmas_*stdmax;
   _uclx_ = expmax + _sigmas_*stdmax;
   _mean_ = expmax;
   call symput('avgmax',left(put(expmax,8.1)));
run;
The control limits are computed using the fact that the maximum of a sample of size 20 from a normal population with zero
mean and unit standard deviation has an expected value of 1.86747 and a standard deviation of 0.52509; refer to Teichroew
(1962) and see Table 17.13. Finally, the following statements create a box chart for LogLength that displays control limits for the subgroup maximum:
ods graphics off;
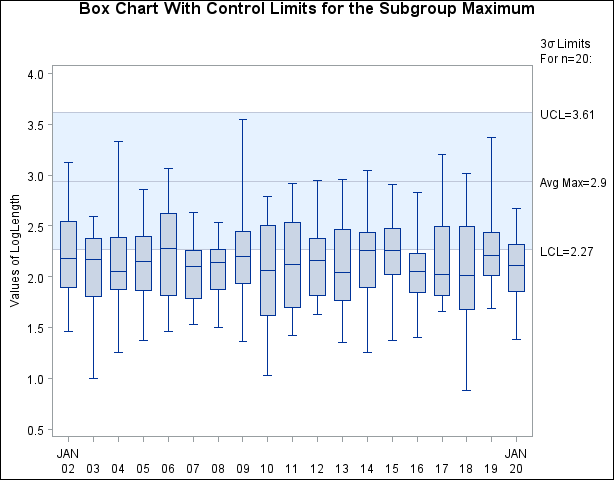
title 'Box Chart With Control Limits for the Subgroup Maximum';
symbol v=none;
proc shewhart data=lengdata limits=maxlim;
boxchart LogLength*Day /
ranges
serifs
nohlabel
nolegend
xsymbol="Avg Max=&AVGMAX" ;
label LogLength='Values of LogLength';
run;
The box chart, shown in Output 17.6.1, indicates that the maximum is in control since the tips of the upper whiskers fall within the control limits.
The SYMPUT call is used to pass the value of _MEAN_ in a macro variable to the SHEWHART procedure so that this value can be used to label the central line.
You can apply the variable replacement method shown here to data with sample sizes other than 20 by replacing the constants 1.86747 and 0.52509 with the appropriate values from Table 17.13. Austin (1973) describes a method for approximating these values. You can also use the preceding statements to display control limits for the subgroup minimum by changing the sign of the expected values in Table 17.13.
Output 17.6.1: Box Chart for Subgroup Maximum
The variable replacement method can also be used to create a variety of box charts, including the modifications suggested by Iglewicz and Hoaglin (1987) and Rocke (1989).
Table 17.13: Expected Values and Standard Deviations of Maximum of a Normal Sample
|
n |
Expected Value |
Standard Deviation |
|---|---|---|
|
2 |
0.56418 |
0.82565 |
|
3 |
0.84628 |
0.74798 |
|
4 |
1.02937 |
0.70123 |
|
5 |
1.16296 |
0.66899 |
|
6 |
1.26720 |
0.64494 |
|
7 |
1.35217 |
0.62605 |
|
8 |
1.42360 |
0.61065 |
|
9 |
1.48501 |
0.59780 |
|
10 |
1.53875 |
0.58681 |
|
11 |
1.58643 |
0.57730 |
|
12 |
1.62922 |
0.56891 |
|
13 |
1.66799 |
0.56144 |
|
14 |
1.70338 |
0.55474 |
|
15 |
1.73591 |
0.54869 |
|
16 |
1.76599 |
0.54316 |
|
17 |
1.79394 |
0.53809 |
|
18 |
1.82003 |
0.53342 |
|
19 |
1.84448 |
0.52910 |
|
20 |
1.86747 |
0.52509 |