Details and Examples: PARETO Procedure
-
Details

-
ExamplesCreating Before-and-After Pareto ChartsCreating Two-Way Comparative Pareto ChartsHighlighting the Vital FewHighlighting Combinations of CategoriesHighlighting Combinations of CellsOrdering Rows and Columns in a Comparative Pareto ChartMerging Columns in a Comparative Pareto ChartCreating Weighted Pareto ChartsAlternative Pareto Charts
Example 15.9 Alternative Pareto Charts
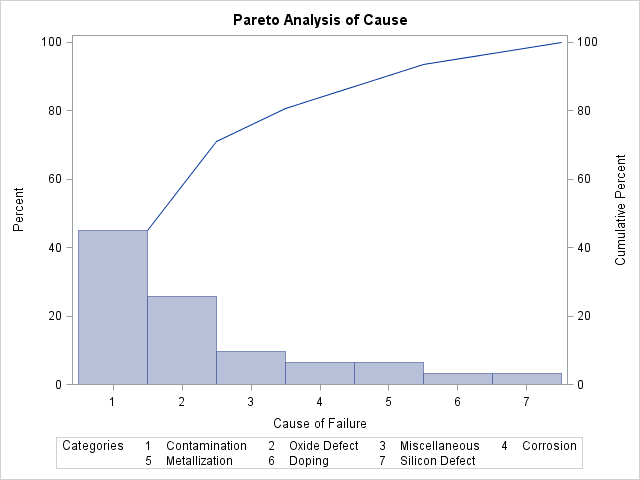
This example uses the Failure1 data set of integrated circuit fabrication failures from the section Getting Started: VBAR Statement. The following statements produce a standard Pareto chart, a cumulative Pareto bar chart, and a Pareto dot plot with acceptance
intervals of the data: CHARTTYPE= option.
ods graphics on;
proc pareto data=Failure1;
   vbar Cause;
   vbar Cause / charttype=cumulative;
   vbar Cause / charttype=intervals;
run;
Note that ODS Graphics must be enabled for you to use the CHARTTYPE= option.
Output 15.9.1 shows the standard Pareto chart.
Output 15.9.1: Standard Pareto Chart
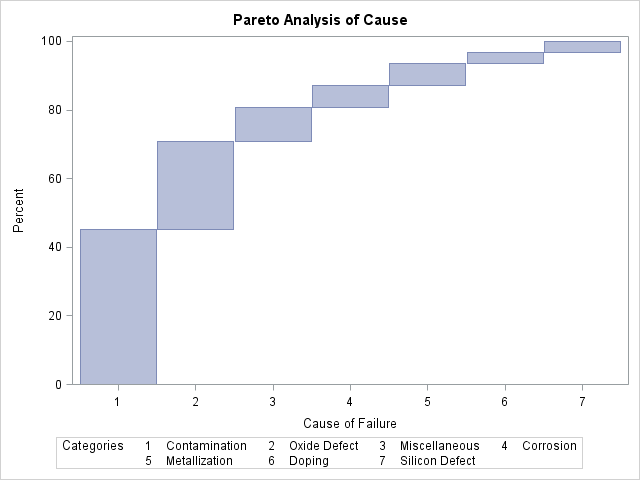
Output 15.9.2 shows the cumulative Pareto bar chart.
Output 15.9.2: Cumulative Pareto Bar Chart
Output 15.9.3 shows the Pareto dot plot with acceptance intervals.
Output 15.9.3: Pareto Dot Plot with Acceptance Intervals
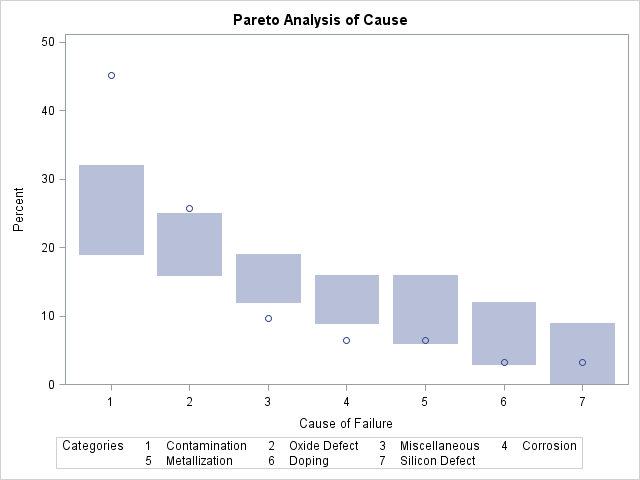
The chart shows that the most frequently occurring problem, Contamination, does occur more frequently than the first-ranked cause from a random sample of seven uniformly distributed causes. This indicates that addressing contamination problems should be given a high priority.