Details and Examples: PARETO Procedure
-
Details

-
ExamplesCreating Before-and-After Pareto ChartsCreating Two-Way Comparative Pareto ChartsHighlighting the Vital FewHighlighting Combinations of CategoriesHighlighting Combinations of CellsOrdering Rows and Columns in a Comparative Pareto ChartMerging Columns in a Comparative Pareto ChartCreating Weighted Pareto ChartsAlternative Pareto Charts
Example 15.4 Highlighting Combinations of Categories
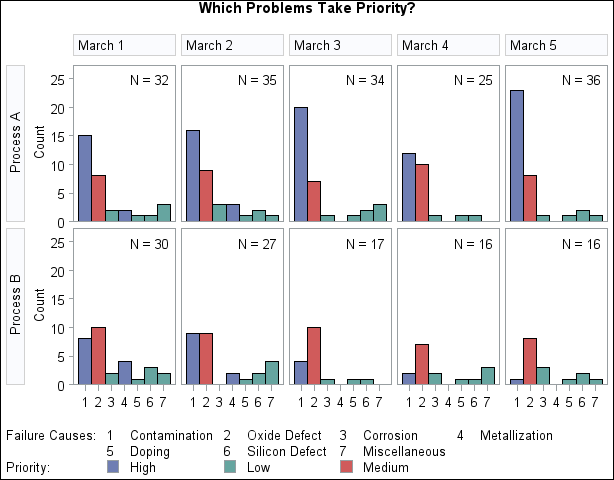
See PARETO11 in the SAS/QC Sample LibraryIn some applications, it is useful to classify the categories into groups that are not necessarily related to frequency. This example, which is a continuation of Example 15.2, shows how you can display this classification with a bar legend.
Suppose that Contamination and Metallization are high priority problems, Oxide Defect is a medium priority problem, and all
other categories are low priority problems. Begin by adding this information to the data set Failure4.
data Failure4;
   length priority $ 16;
   set Failure4;
   if Cause = 'Contamination' or
      Cause = 'Metallization'
   then do;
      priority = 'High';
   end;
   else
   if Cause = 'Oxide Defect'
   then do;
      priority = 'Medium';
   end;
   else do;
      priority = 'Low';
   end;
run;
The variable PRIORITY indicates the priority, and the variables COLOR and PATTERN (character variables of length eight) provide colors and patterns corresponding to the levels of PRIORITY. The pattern values 'S' and 'M5X45' correspond to a solid fill and a crosshatched fill, respectively.
The following statements specify PRIORITY as a BARLEGEND= variable, COLOR as a CBARS= variable, and PATTERN as a PBARS= variable:
ods graphics off;
goptions vsize=4.25 in htext=2.8 pct htitle=3.2 pct;
title 'Which Problems Take Priority?';
proc pareto data=Failure4;
   vbar Cause / class       = ( Process Day )
                freq        = Counts
                nrows       = 2
                ncols       = 5
                last        = 'Miscellaneous'
                scale       = count
                bars        = ( priority )
                barlegend   = ( priority )
                barleglabel = 'Priority:'
                catleglabel = 'Failure Causes:'
                intertile   = 1.0
                nohlabel
                nocurve
                nlegend;
run;
Note that the BARLEGEND=, CBARS=, and PBARS= variable names are enclosed in parentheses. (Parentheses are not used when you specify fixed colors and patterns with the CBARS= and PBARS= options, as in Example 15.2.)
The chart is displayed in Output 15.4.1. The levels of the BARLEGEND= variable are the values displayed in the legend labeled Priority: at the bottom of the chart.
In general, when you create CBARS=, PBARS=, and BARLEGEND= variables, their values must be consistent and unambiguous. You must assign distinct color and pattern values to the CBARS= and PBARS= variables for each level of the BARLEGEND= variable. It is not necessary to specify a PBARS= variable to accompany a BARLEGEND= variable, and if a PBARS= variable is omitted, the bars are filled with solid colors.
For further details, see the entries for the BARLEGEND=, CBARS=, and PBARS= options in Dictionary of Options.
Output 15.4.1: Highlighting Selected Subsets of Categories