Details and Examples: PARETO Procedure
-
Details

-
Examples
Creating Before-and-After Pareto Charts Creating Two-Way Comparative Pareto Charts Highlighting the Vital Few Highlighting Combinations of Categories Highlighting Combinations of Cells Ordering Rows and Columns in a Comparative Pareto Chart Merging Columns in a Comparative Pareto Chart Creating Weighted Pareto Charts
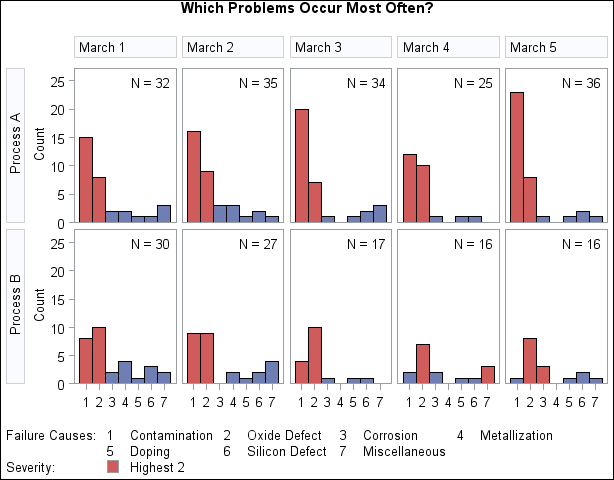
Example 13.3 Highlighting the "Vital Few"
[See PARETO10 in the SAS/QC Sample Library]This example is a continuation of Example 13.2.
In some applications you may want to use colors and patterns to highlight the bars corresponding to the most frequently occurring categories, which are referred to as the "vital few."
The following statements highlight the two most frequently occurring categories in each cell of the comparative Pareto chart shown in Output 13.2.4:
ods graphics off;
goptions vsize=4.25 in htext=2.8 pct htitle=3.2 pct;
title 'Which Problems Occur Most Often?';
proc pareto data=Failure4;
   vbar Cause / class       = ( Process Day )
                freq        = Counts
                nrows       = 2
                ncols       = 5
                last        = 'Miscellaneous'
                scale       = count
                chigh(2)
                hlleglabel  = 'Severity:'
                catleglabel = 'Failure Causes:'
                intertile   = 1.0
                nohlabel
                nocurve
                nlegend;
run;
Specifying CHIGH(2)=GREEN and PHIGH(2)=M5X45 causes the two highest bars in each cell to be filled in green with the pattern M5X45 (refer to SAS/GRAPH: Reference for a pattern selection guide). If you omit the PHIGH(2)= option, a solid green fill is used.
The new chart is displayed in Output 13.3.1. In all but two of the cells, the two vital problems are Contamination and Oxide Defect.
You can also highlight the "trivial many" categories (also referred to as the "useful many") with the CLOW( )= and PLOW()= options. You can use these options in conjunction with the CHIGH(
 )=, PHIGH()=, CBARS=, and PBARS= options. For further details, see the entries for these options in the Dictionary of Options.